
Main Points :
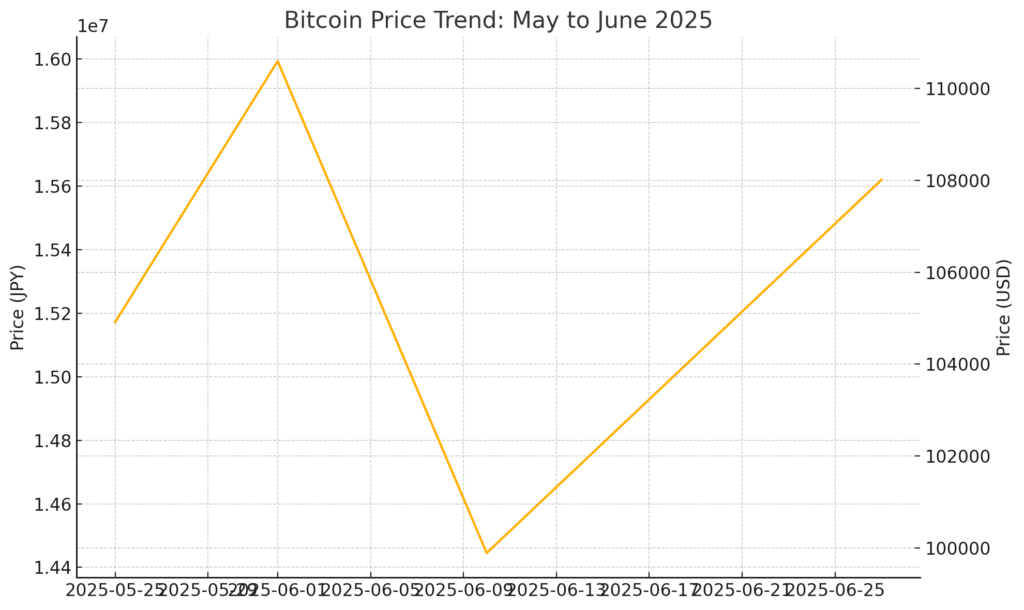
- Bitcoin has traded between a roughly ¥14.4 million ($99.9 K) support and ¥16.1 million ($111.5 K) resistance since late May, with the intra-period high of ¥15,993,884 ($110,510) and low of ¥14,445,066 ($99,915).
- As of June 27, 2025, price sits at ¥15.62 million ($107,962), near the center of this range.
- Market flows into digital-asset investment products remain robust: June saw the 10th straight week of inflows totalling $1.24 billion, led by Bitcoin’s $1.1 billion share.
- Institutional adoption is accelerating: Fidelity reports Bitcoin’s “acceleration phase” of its bull market, characterized by higher volatility and potential for a final surge.
- Technical outlook hinges on a decisive break above ¥16.1 million ($111.5 K) or below ¥14.4 million ($99.9 K); a July breakout could set the next directional trend.
Price Range Analysis: Support and Resistance
Since May 25, 2025, Bitcoin has formed a horizontal channel between key technical thresholds: a support zone at roughly ¥14.4 million ($99.9 K) and resistance near ¥16.1 million ($111.5 K).
- Intra-Period Peaks and Troughs
- High: ¥15,993,884 (June 1) $110,510.
- Low: ¥14,445,066 (June 10) $99,915.
- Mid-Range Stability
- As of June 27, price sits at ¥15,620,000 ($107,962), showing neither bullish nor bearish conviction within this channel.
- The pattern suggests accumulation and distribution phases as traders await a catalyst for a directional move.
- Chart Overview
The figure above shows Bitcoin’s price in JPY (left axis) and USD (right axis), plotting May 25 → June 27 movements. Notice how the ¥14.4 million ($99.9 K) support ($99.9 K) held firm on June 10, and the ¥16.1 million ($111.5 K) resistance repelled attempts around June 1 and later June 27.
Market Flow Trends: Institutional Inflows
Institutional interest continues unabated. According to CoinShares’ June 23 report, digital-asset products logged their 10th consecutive week of inflows, totalling $1.24 billion, with Bitcoin capturing $1.1 billion of that figure.
- YTD Flows: A record $15.1 billion has entered crypto funds by mid-June.
- Regional Breakdown: The United States led inflows ($1.25 billion), underscoring growing acceptance by U.S. institutions.
Fidelity’s “Crypto Midyear Outlook 2025” characterizes Bitcoin’s current stage as an “acceleration phase,” typically the final bullish stretch with heightened volatility and a potential parabolic run.
Broader Crypto Adoption: Beyond Bitcoin
- Ethereum Inflows: While Bitcoin dominated, Ethereum also saw $124 million in June inflows, its strongest since February.
- Stablecoin Developments: Fidelity’s forthcoming stablecoin initiative signals a push for regulated, dollar-backed digital assets
- ETF Expansion: BlackRock is exploring additional crypto ETFs (Cardano, Polkadot, Solana), leveraging the success of its iShares Bitcoin Trust (fastest-growing ETF ever at $70 billion AUM).
Technical Outlook: July Breakout Probability
Market psychology around month-end can be a catalyst: historically, the close of a month often triggers stop-runs that fuel momentum into the new month.
- Bull Case: A push above ¥16.1 million ($111.5 K) on strong volume could spark a rally toward prior all-time highs (¥20 million+/$138 K+).
- Bear Case: A slip below ¥14.4 million ($99.9 K) risks targeting the next support at ¥13 million ($90 K).
Key levels:
| Level | JPY | USD (1 USD = ¥144.61) |
|---|---|---|
| Resistance | ¥16,100,000 | $111,500 |
| Recent High | ¥15,993,884 | $110,510 |
| Mid-Channel (Current) | ¥15,620,000 | $107,962 |
| Support | ¥14,400,000 | $99,915 |
| Recent Low | ¥14,445,066 | $99,915 |
Practical Takeaways for Crypto Seekers
- Range Trading: Opportunistic traders can buy near support ¥16.1 M ($111.5 K), with tight stops if the channel breaks.
- Position Sizing: Given high inflows and volatility, consider smaller allocations (1-3% of portfolio) ahead of potential breakouts.
- Long-Term Holders: Institutional adoption trends suggest preparing for a July bull run; dollar-cost averaging (DCA) into dips may capture gains if acceleration phase continues.
Conclusion
Bitcoin’s sideways movement between ¥14.4 million ($99.9 K) and ¥16.1 million ($111.5 K) since late May reflects a market in balance—firms and funds are actively allocating, yet technical conviction awaits a clear breakout. With robust institutional inflows ($1.24 billion in June), and growing ecosystem developments (stablecoins, ETFs), the odds favor a meaningful move in July. Traders should watch the month-end close and volume spikes around ¥16.1 million ($111.5 K) for clues. Should support at ¥14.4 million ($99.9 K) fail, risk management is paramount. Yet if Bitcoin vaults above resistance, the next leg toward new highs could be well underway.
