
Main Points:
- Bitcoin has broken out of a prolonged range around ¥15–16 million ($110,000–$112,000) and is testing new highs after rebounding from key support.
- From early June through early July, BTC/JPY formed a clear trading range between ¥14.4 million and ¥16.1 million ($102,857–$115,000).
- A decisive close above ¥16.1 million ($112,022) could spark a fresh bullish leg, buoyed by macro tailwinds and institutional flows.
- Failure to sustain the breakout may see BTC retest the ¥14.4 million ($102,857) support or continue range-bound trading.
- Broader market sentiment, including U.S. policy and ETF inflows, will likely influence Bitcoin’s next move.
1. Bitcoin’s Sustained Momentum? The Onset of a Rally
In mid-2025, Bitcoin traded sideways as investors awaited a catalyst. After several weeks of containment between ¥14.4 million ($100,000) and ¥16.1 million ($112,022), BTC/JPY finally pierced its ceiling on July 9, 2025, closing above ¥16,100,000 ($112,022) on some exchanges, marking its first meaningful breakout since May. Ethereum’s concurrent uptick has reinforced bullish sentiment, encouraging buyers to reenter the market. Analysts suggest that if Bitcoin can hold above the breakout level for the next 24 hours, it may confirm a shift from range-bound trading to a sustained uptrend.
Institutional flows have also picked up. According to MarketWatch, over $11 billion flowed into Bitcoin ETFs in recent weeks, driving demand and narrowing the gap to record highs near $112,000. Additionally, announcements by major firms—such as GameStop and Trump Media & Technology Group—indicate plans to allocate portions of their treasuries to Bitcoin, further bolstering confidence.
2. Range Formation and Key Levels: Early June to Early July
Range Characteristics
From June 1 to July 7, Bitcoin’s hourly charts clearly show a trading corridor:
- Resistance: ¥16,100,000 ($112,022)
- Support: ¥14,400,000 ($100,000)
During this period, BTC repeatedly approached both boundaries without a decisive breach, reflecting equilibrium between bullish and bearish forces. Highs clustered around ¥15,993,884 ($111,367), confirming the upper limit’s strength. Lows tested ¥14,445,066 ($100,512), illustrating support resilience.
Price Action Highlights
- June 1, 2025: Open at ¥15,171,856 ($105,442), followed by a rally to near-resistance highs.
- Mid-June: Multiple rejections at ¥16.1 million ($100,000). Investors capitalized on strength to book profits.
- June 23, 2025: Drop to ¥14,395,223 ($100,512), testing the lower boundary.
- Late June: Support held at ¥14.4 million ($78,000), prompting another bounce.
This range-bound behavior suggested an indecisive market, with traders buying dips near support and selling rallies near resistance.
3. Recent Price Dynamics and Focus Ahead: Rebound and Bullish Expectations
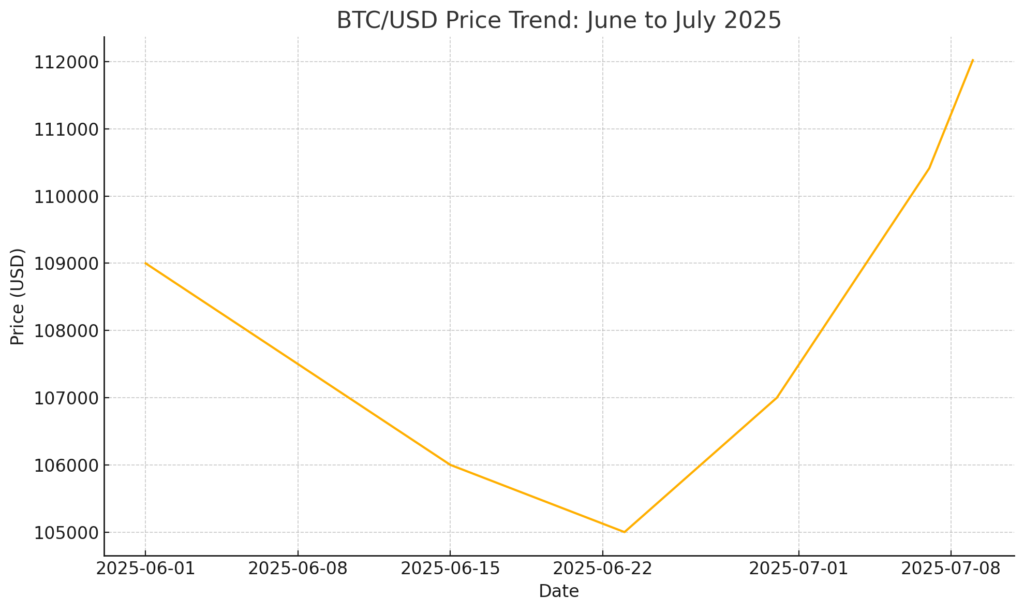
As illustrated in the chart above, Bitcoin’s price bottomed on June 23 at $105,000, then staged a strong rebound into early July. By July 9, it had rallied to $112,022, briefly setting a new intra-day high. Short-term supporters now watch two key zones:
- Intermediate Resistance: $111,980 (previous 52-week high).
- Critical Resistance: $115,300 (long-term trendline).
A close above $110,530 would signal renewed upside momentum on shorter timeframes, while surpassing $115,300 could confirm a full trend reversal from the April correction lows near $74,500.
Macro catalysts are currently supportive. Fed minutes released in early July hinted at possible rate cuts if inflation moderates, which tends to favor risk assets like Bitcoin. Meanwhile, the U.S. dollar has weakened against major currencies, reducing headwinds for dollar-denominated Bitcoin purchases.
4. Breaking Resistance and Market Psychology: Potential Scenarios
Scenario A: Bullish Breakout
If BTC sustains above ¥16.1 million ($112,022) and builds a daily close over that level, this previous ceiling could flip to support. Confirmation might occur upon a pullback to ¥16.1 million ($112,022) that holds, inviting fresh buying. Institutions and high-net-worth individuals could accelerate inflows, targeting new all-time highs near $115,300 and beyond. Momentum indicators such as RSI likely remain constructive, and technical analysts would interpret the move as a bull-market retest.
Scenario B: False Breakout and Range Continuation
Given the history of rejections at this region, failure to hold above resistance could indicate a bull-trap, leading to profit-taking. Price may then slide back into the ¥14.4 ($78,000)–16.1 million ($100,000) range. Investors would need to re-evaluate support at ¥14.4 million ($78,000).
Market Psychology
The collective mindset is a mix of optimism and caution. Traders recall prior peaks and are wary of overextensions. Yet, growing institutional adoption and favorable macroeconomic signals have instilled confidence. Sentiment indicators show less fear compared to early 2025 lows, and a successful breakout could tip sentiment decisively bullish.
Conclusion
Bitcoin’s recent breakout above ¥16.1 million ($100,000) support and dampening market enthusiasm.
Investors seeking new crypto assets and practical blockchain opportunities should monitor these thresholds closely. A confirmed breakout may herald attractive entry points for yield-generating strategies and next-generation DeFi products. Should resistance prove insurmountable, capital preservation near support zones will be paramount until clearer directional bias emerges.
