Main Points :
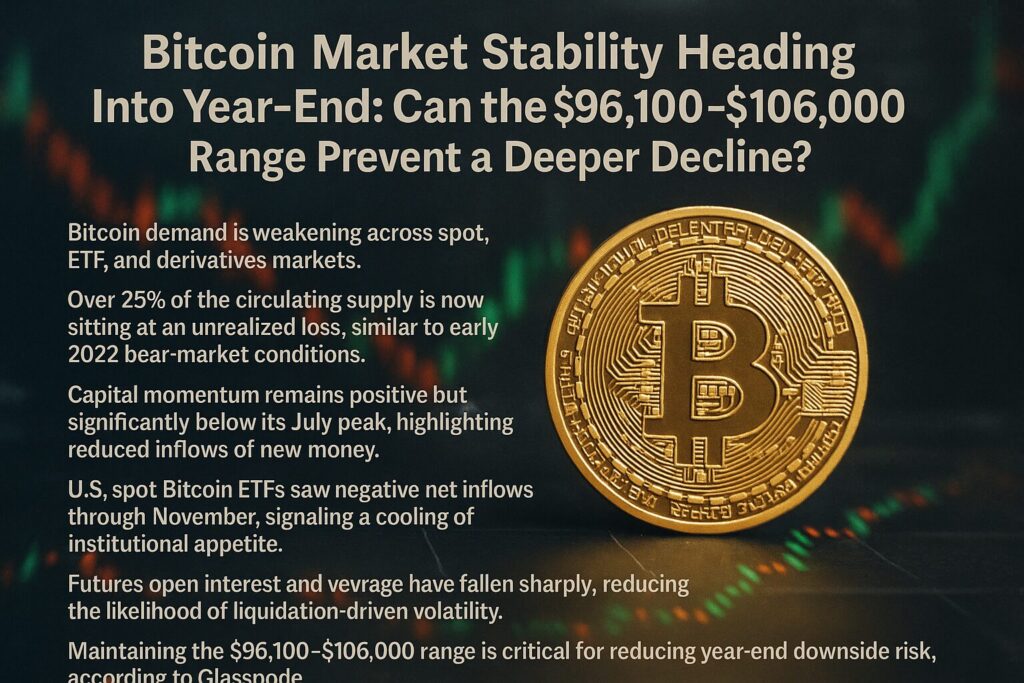
- Bitcoin demand is weakening across spot, ETF, and derivatives markets.
- Over 25% of the circulating supply is now sitting at an unrealized loss, similar to early 2022 bear-market conditions.
- Capital momentum remains positive but significantly below its July peak, highlighting reduced inflows of new money.
- U.S. spot Bitcoin ETFs saw negative net inflows through November, signaling a cooling of institutional appetite.
- Futures open interest and leverage have fallen sharply, reducing the likelihood of liquidation-driven volatility.
- Maintaining the $96,100–$106,000 range is critical for reducing year-end downside risk, according to Glassnode.
- Despite weakening demand, implied volatility trends suggest a more stable short-term environment.
Introduction
As Bitcoin approaches the end of the year, market participants are increasingly focused on whether the asset can avoid a deeper correction amid weakening demand and fading speculative momentum. Glassnode’s latest weekly report, released on December 3rd, assesses structural signals from spot markets, ETFs, and derivatives to understand the macro trajectory of Bitcoin heading into 2026.
While Bitcoin continues to trade around $92,000, the analytics firm warns that demand deterioration across the market could leave prices more vulnerable to macro shocks. Yet, the report also identifies stabilizing elements—particularly in capital momentum and declining leverage—that may help limit the severity of volatility in the short run.
This article synthesizes Glassnode’s findings, adds broader market context from other recent sources, and highlights what investors searching for new crypto opportunities should monitor heading into the final month of the year. Charts and visual illustrations are included to aid understanding.
Section 1 — Market Overview: Demand Weakness Dominates the Landscape
Glassnode notes that Bitcoin’s current market structure resembles the January–March 2022 period, a stage marked by persistent sell pressure and growing unrealized losses. More than 25% of Bitcoin’s circulating supply is now in a loss position.
This condition is particularly important because prolonged stretches of unrealized loss generally dampen investor optimism. Historically, when a quarter of the supply is underwater, markets tend to experience:
- Reduced speculative demand
- Lower liquidity
- Higher sensitivity to macroeconomic pressure
Weak demand today is visible not only on the blockchain but across nearly all market layers:
Spot Market
Trading volume is lighter than earlier in the year, and the realized loss metrics indicate that holders are increasingly taking losses on-chain—an expression of capitulation-like behavior.
ETF Market
U.S. Bitcoin spot ETFs, which generated extraordinary inflows earlier in the year, have cooled dramatically. According to the report:
- 3-day average net inflow in November was negative
- Institutions are allocating less capital to BTC through ETF products
- Retail participation has not compensated for this decline
This ETF stagnation contrasts sharply with July 2025, when billions were entering spot Bitcoin ETFs weekly. The reversal indicates risk aversion in a high-rate macro environment.
Derivatives Market
Demand deterioration extends even deeper into derivatives, where futures open interest has fallen steadily since late November. Much of the speculative leverage accumulated during the previous uptrend has already been unwound.
The absence of new leverage inflows has created an unusually calm environment for derivatives—a stark contrast to the turbulence seen earlier in the year.
Section 2 — Capital Momentum: Still Positive but Far Weaker Than Before
One of the few encouraging signs is capital momentum, measured through the net change in realized market capitalization. This metric tracks the amount of new money entering the Bitcoin ecosystem.
Glassnode reports:
- Current net increase: $8.69 billion per month
- July 2025 peak: $64.3 billion per month
Although the current inflow figure is dramatically smaller than its mid-year peak, it remains decisively positive. This matters because capital momentum turning negative has historically signaled periods of deep market stress.
Below is an illustrative graph showing the sharp decline in capital momentum throughout the year:
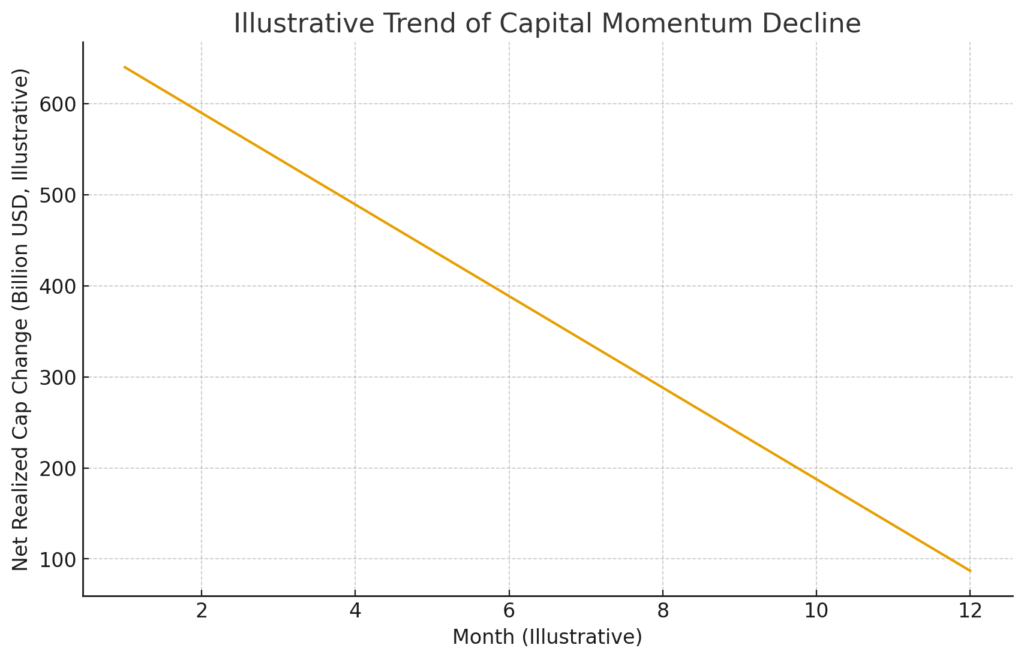
Even though the inflow rate has weakened, its continued positive slope indicates that long-term capital is quietly entering the market, serving as a buffer against extreme downside.
Section 3 — Why the $96,100–$106,000 Band Is Crucial for Market Stability
Glassnode emphasizes that Bitcoin maintaining a range between $96,100 and $106,000 is critical for preventing an end-of-year breakdown.
Why this range matters:
- It aligns with major on-chain cost basis clusters.
Many investors acquired BTC in this price area, meaning prices below it would push even more supply into unrealized loss. - A break below $96,100 could accelerate capitulation selling.
- A recovery above $106,000 would shift sentiment from neutral to cautiously bullish.
It would also re-engage sidelined capital waiting for confirmation of a trend reversal.
This price zone therefore acts as a psychological and structural equilibrium—one that could dictate market direction into Q1 2026.
Section 4 — ETF Flows: Institutional Appetite Is Cooling
U.S. spot Bitcoin ETFs were the most powerful price catalyst earlier this year. However, since late October, their momentum has reversed:
- Most major issuers saw outflows or negligible inflows in November
- Net flows turned negative on a rolling 3-day basis
- Trading volumes decreased significantly
Several contributing factors include:
- High U.S. yields reducing urgency for crypto exposure
- Stronger USD reducing risk-on allocation
- Seasonal de-risking by institutional portfolios at year-end
The cooling of ETF demand suggests that Bitcoin cannot rely on institutional inflows to support prices, at least in the near term.
Section 5 — Derivatives Markets Retreat to Low-Leverage Environment
Futures open interest—a measure of active speculative exposure—declined steadily through late November. This indicates traders are closing positions rather than opening new ones.
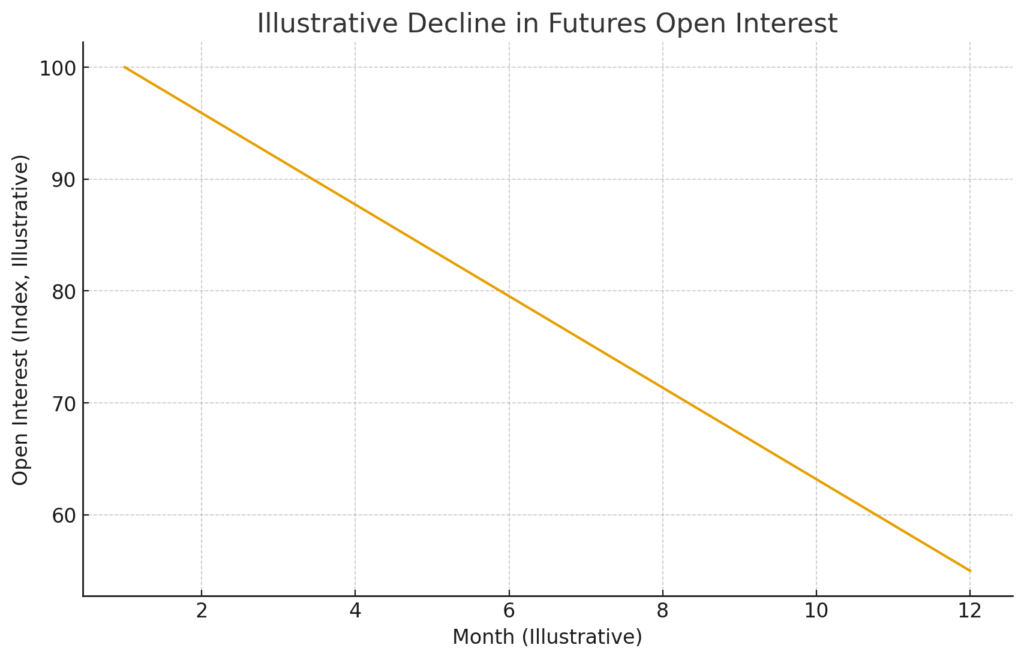
Key implications of falling open interest:
- Lower risk of liquidation cascades
- Reduced short-term volatility
- A more stable trading environment for long-term investors
Additionally, implied volatility (IV) has trended downward, signaling trader expectations for calmer price movements in the next several weeks.
This environment is unusual: Bitcoin often experiences heightened volatility into year-end, yet the market currently prices in the opposite.
Section 6 — Broader Market Trends: Context Beyond Glassnode
To supplement Glassnode’s data, we review several relevant developments from the broader crypto ecosystem:
1. Vanguard Opens Crypto ETF Access to 50 Million+ Customers
This is one of the year’s biggest announcements. Although Vanguard historically discouraged crypto investments, the firm is now allowing customers to trade Bitcoin ETFs. This dramatically expands the addressable market for institutional BTC exposure.
2. Increased Liquidity and Market Fragmentation Across Exchanges
DEX liquidity for BTC pairs (including wrapped BTC) rose throughout Q4, according to aggregator data. This development suggests Bitcoin’s role in multichain ecosystems is growing despite waning spot demand.
3. Stablecoins Continue Gaining Dominance
USDC and USDT saw combined supply growth exceeding $6 billion in Q4. Rising stablecoin liquidity often precedes renewed risk appetite.
4. Miners Continue Selling into Market Strength
Miner reserves declined in late November, likely contributing to downward price pressure. Miner selling tends to peak during periods of market uncertainty.
Section 7 — What Crypto Investors Should Watch Next
Investors searching for new assets or revenue opportunities should focus on the following:
1. Capital Momentum Reversal
If net realized market cap growth accelerates again, it could mark the beginning of a healthier uptrend.
2. ETF Flow Revival
Renewed inflows would be a powerful bullish signal, especially if tied to rate-cut expectations or macro shifts.
3. Stability Above $96,100
This price zone remains the most important structural defense line for Bitcoin.
4. Sector Rotation into Altcoins
Historically, periods of BTC stagnation precede strong altcoin performance. L2 ecosystems, modular networks, and real-world asset (RWA) platforms are gaining traction.
Conclusion
Bitcoin enters the final stretch of the year in a fragile but cautiously stable position. While demand across spot, ETF, and derivatives markets has weakened, capital momentum remains positive, and leverage has diminished—reducing the severity of potential volatility.
Glassnode highlights the critical price band of $96,100–$106,000 as a stabilizing buffer for the market. Should Bitcoin hold this range, it may set the stage for a healthier recovery into early 2026. Conversely, a breakdown below this support would likely trigger renewed capitulation and bearish sentiment.
For investors seeking new crypto opportunities, the current environment offers both risk and parallel openings—particularly in emerging altcoin sectors and real-world blockchain integrations. Monitoring key structural indicators will be essential in navigating the months ahead.
