Key Points :
- Bitcoin is currently trading around $74,000, approaching a critical resistance near $78,100
- Market structure suggests a “fragile recovery” driven by profit-taking behavior
- Short-term holder profit ratio remains below historical top signals, indicating room for upside
- However, realized profit/loss behavior shows investors exiting early, limiting momentum
- Institutional flows (especially ETFs) are improving, but conviction remains weak
- A strong demand catalyst is required to break through resistance and confirm a bull trend
1. The Fragile Recovery: A Market Without Conviction
Bitcoin’s recent price movement reflects a paradox that seasoned market participants know all too well: price can rise even when conviction is weak.
At approximately $74,000, Bitcoin has staged a notable recovery from recent lows. On the surface, this looks like the early stages of a bullish continuation. However, a deeper look into on-chain data and derivatives positioning reveals a different narrative—one of hesitation, distribution, and tactical exits rather than aggressive accumulation.
The current structure resembles what analysts often call a “bear market rally”—a temporary upward movement driven more by short-term positioning and liquidity than by strong, long-term conviction. Investors, particularly those who entered during higher price levels, appear eager to exit positions as soon as they approach break-even or slight profit territory.
This creates a dynamic where every rally is met with supply, effectively capping upward momentum.
2. The $78,100 Resistance: Psychological and Structural Barrier
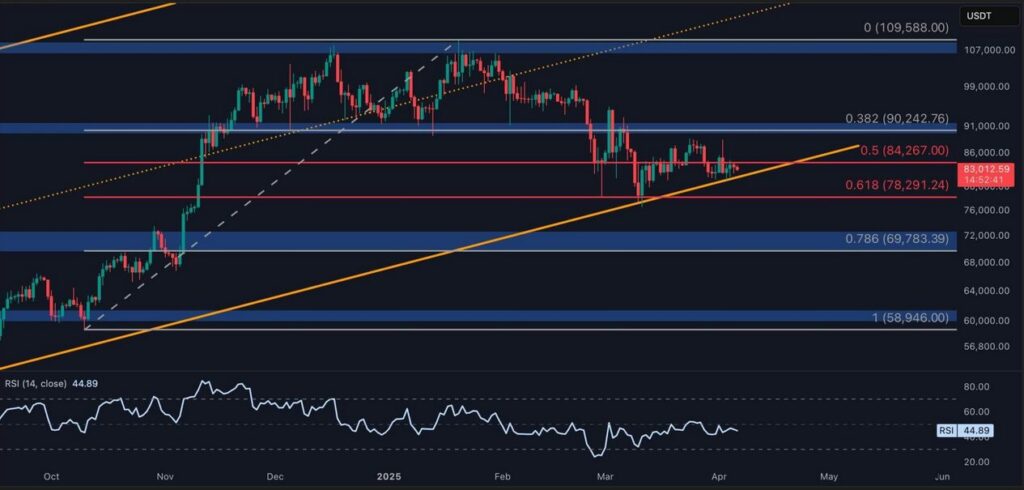
The level around $78,100 is not just a number—it represents a convergence of technical resistance, psychological pressure, and on-chain supply dynamics.
Historically, such levels become critical because they align with:
- Previous support zones that turned into resistance
- High-volume trading areas (where many investors are “trapped”)
- Break-even levels for large cohorts of holders
Currently, Bitcoin is trading about 5% below this resistance, leaving room for a short-term rally. However, as price approaches this zone, sell pressure is expected to intensify sharply.
From a price-action psychology perspective, this is where:
- Early buyers take profits
- Late buyers panic-sell
- Market makers exploit liquidity pockets
If Bitcoin fails to break this level convincingly, it reinforces the range-bound or corrective market structure.
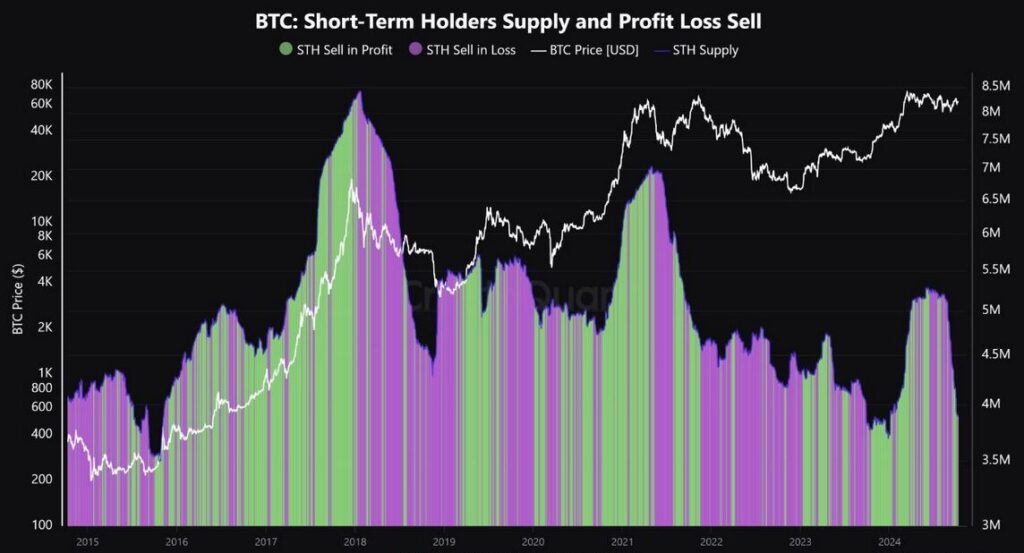
3. Short-Term Holder Behavior: The Hidden Driver of Volatility
One of the most critical metrics in the current market is the Short-Term Holder (STH) Profit Supply Ratio, currently sitting at 43.2%.
To understand its importance:
- Historically, 54.2% marks a level where local tops are frequently formed
- Current levels suggest the market is not yet overheated
- However, it is approaching a zone where distribution typically accelerates
This creates a tension point in the market:
- There is still upside potential
- But the closer price gets to resistance, the more likely holders are to sell
In practical terms, this means:
The rally still has fuel—but that fuel is being burned faster than it is replenished.
4. Realized Profit/Loss: Evidence of Early Exit Behavior
Another telling metric is the Realized Profit/Loss Ratio, currently at 1.16.
This indicates that:
- More profits are being realized than losses
- Investors are actively closing positions
- Many exits are happening near break-even or marginal profit levels
This behavior is typical of uncertain markets, where participants:
- Do not trust the sustainability of the rally
- Prefer capital preservation over aggressive upside exposure
Even as spot demand and ETF inflows improve, this pattern suggests that confidence has not yet returned to the market.
5. ETF Flows and Institutional Participation: A Partial Tailwind
In recent cycles, institutional flows—particularly via Bitcoin ETFs—have become a dominant force in shaping price trends.
Recent data indicates:
- Renewed inflows into Bitcoin ETFs
- Gradual recovery in spot demand
- Increased attention from macro investors
However, there is a critical nuance:
Flows are improving, but positioning remains cautious.
Options markets, for example, show defensive positioning, with traders hedging downside risk rather than aggressively betting on upside continuation.
This creates a situation where:
- Institutions are participating
- But they are not yet committing decisively
For the market to transition into a strong bull phase, ETF demand must shift from passive inflow to aggressive accumulation.
6. The Liquidity Battlefield: Why Markets Feel “Heavy”

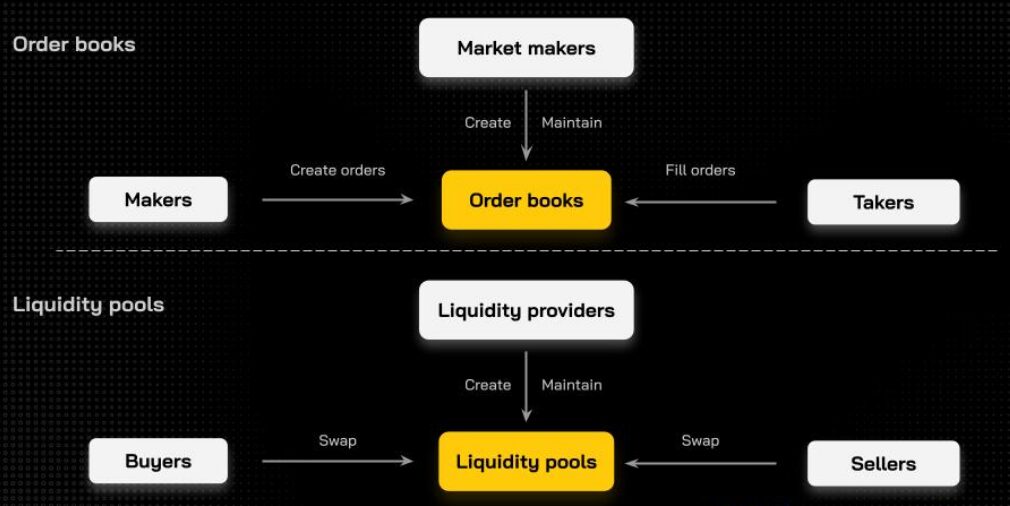
Modern crypto markets are best understood as liquidity battlefields.
At current levels:
- Liquidity clusters exist above $78,000 (short liquidations)
- Sell walls are forming near resistance
- Buyers are stepping in cautiously, not aggressively
This leads to a “heavy” market feeling:
- Price moves upward slowly
- Volatility spikes during liquidations
- Momentum fails to sustain
In essence, the market is flow-driven rather than conviction-driven.
7. What Could Break the Ceiling? The Catalyst Question
For Bitcoin to break above $78,100 and sustain a move higher, the market needs a clear and powerful catalyst.
Potential catalysts include:
1. Strong ETF Inflows Acceleration
A surge in institutional demand could absorb sell pressure.
2. Macro Tailwinds
- Interest rate cuts
- Weakening USD
- Geopolitical instability
These factors historically push capital into Bitcoin as a hedge asset.
3. On-Chain Accumulation Shift
A transition from distribution to accumulation among:
- Long-term holders
- Whales
- Institutional wallets
4. Narrative Shift
Markets are driven by stories as much as data. A renewed narrative such as:
- “Bitcoin as digital gold”
- “ETF-driven supercycle”
could reignite retail and institutional enthusiasm.
8. Scenario Analysis: What Happens Next?
Scenario A: Rejection at $78,100
- Price fails to break resistance
- Profit-taking intensifies
- Bitcoin revisits lower support zones (~$68,000–$70,000)
Scenario B: Break and Consolidation
- Price breaks above resistance
- Consolidates around $78,000–$82,000
- Builds base for next leg higher
Scenario C: Full Bull Continuation
- Strong catalyst emerges
- Demand overwhelms supply
- Bitcoin enters price discovery mode above $80,000
Conclusion: A Market at the Decision Point
Bitcoin stands at a critical inflection point.
The data tells a consistent story:
- The recovery is real—but fragile
- Demand is improving—but not dominant
- Supply pressure remains a constant threat
The $78,100 level is more than resistance—it is a decision point for the entire market cycle.
If broken with conviction, it could mark the transition into a new bullish phase.
If rejected, it confirms that the market is still trapped in a distribution-driven structure.
For investors seeking new opportunities, this is not a time for blind optimism—but for precision, patience, and strategic positioning.