Key Takeaways :
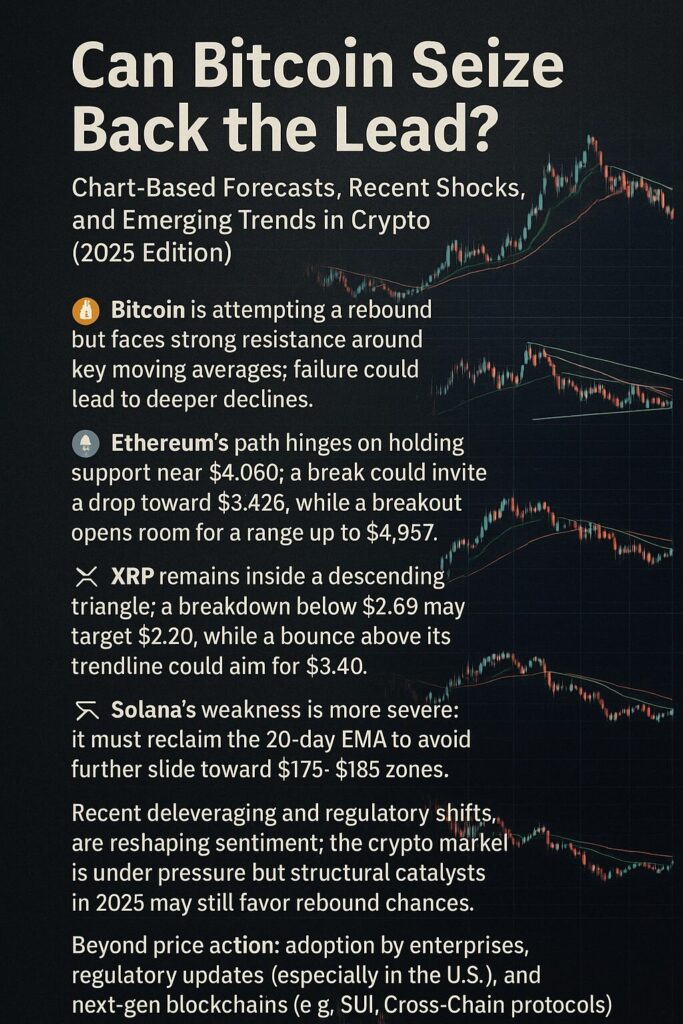
- Bitcoin is attempting a rebound but faces strong resistance around key moving averages; failure could lead to deeper declines.
- Ethereum’s path hinges on holding support near $4,060; a break could invite a drop toward $3,426, while a breakout opens room for a range up to $4,957.
- XRP remains inside a descending triangle; a breakdown below $2.69 may target $2.20, while a bounce above its trendline could aim for $3.40.
- Solana’s weakness is more severe: it must reclaim the 20-day EMA to avoid further slide toward $175–$185 zones.
- Recent deleveraging and regulatory shifts are reshaping sentiment; the crypto market is under pressure but structural catalysts in 2025 may still favor rebound chances.
- Beyond price action: adoption by enterprises, regulatory updates (especially in the U.S.), and next-gen blockchains (e.g. SUI, Cross-Chain protocols) are critical to watch.
1. Bitcoin Price Outlook: Can It Regain Control?
In the source article’s chart analysis, Bitcoin (BTC/USDT) is described as forming a tentative rebound (“自律反発”) near its moving averages, though it “faces strong selling pressure” around those levels. If it fails to maintain that zone, a slide toward $107,000 is possible; below that, a breakdown of a possible “double top” may extend losses to $100,000, with a further target as low as $89,526. Conversely, a successful breakout above the moving average zone might push BTC toward $117,500, and in an ideal bullish run, even $120,000.
As of late September 2025, Bitcoin is trading narrowly around $112,200–$113,500, caught in a tight range as the market awaits stronger directional cues.
Recent pressure came from a major deleveraging event that triggered over $1.5–1.7 billion in liquidations across derivatives markets. Many short-term holders have average entry costs near $111,300—a break under that level could provoke cascading sales.
That said, there are structural tailwinds. The U.S. Securities and Exchange Commission (SEC) has streamlined its approval process for spot crypto ETFs (reducing review from ~270 days to ~75 days for qualifying products), triggering a wave of filings that may attract more capital into the space. If Bitcoin can absorb selling pressure and hold above $111,000–$112,000, it may reassert leadership. A breakout above the moving average resistance gives a credible path toward $117,500 or even $120,000 in extended runs.
2. Ethereum’s Crossroads: Support, Resistance, or Range?
Ethereum (ETH) is described in the original article as battling to hold $4,060 in a rebound, with danger looming if it breaks below the 20-day EMA (around $4,393). The downside targets in that scenario are $3,745 and potentially $3,426. On the flip side, a move above the 20-day EMA suggests a range-bound regime between $4,060 and $4,957.
In recent price action, Ethereum has hovered near $4,140–$4,200, with market expectations hinging on macro cues and regulation. The broader trend in 2025 has favored altcoins somewhat, with Ethereum modestly outperforming Bitcoin year-to-date by about 5%.
However, pressure from derivatives liquidations exposed ETH to steep downside moves in recent days, underscoring that support zones remain fragile. If ETH regains the 20-day EMA decisively, it may stabilize into the projected range. But a breakdown below $4,060 could drag it toward the lower targets.
3. XRP: Testing the Bounds of a Descending Triangle
XRP’s chart is characterized by a descending triangle pattern in the original analysis. The critical threshold is $2.69: if bears can push price below that, the breakdown target is $2.20. If buyers can instead force an ascent above the descending trendline, a move toward $3.40 may become viable.
In practice, XRP has shown relatively modest volatility compared to other coins in the recent selloffs, sometimes even showing slight gains when broader market is weak. This relative stability stems, in part, from XRP’s distinct network use case and the belief among some investors that it operates less like a “pure crypto bet” and more like a payments infrastructure asset.
Nevertheless, the technical trigger remains vivid: if XRP cannot surpass its descending trendline and price slips below $2.69, bearish momentum may accelerate. Conversely, reclaiming that trendline with conviction may invalidate the triangle structure and open a route toward $3.40.
4. Solana: Underperforming and Vulnerable
The article’s chart views for Solana (SOL) suggest the price recently broke below a rising trendline, with bulls attempting to defend support around the 50-day SMA (≈ $206). The downside scenarios point toward $185 and $175 if that support fails. On the flip side, a clean close above the 20-day EMA could embolden bulls to chase $260, though that level is expected to host stiff resistance.
In recent weeks, Solana has indeed underperformed, falling more sharply than Bitcoin or Ethereum. It trades around $210–$213 after dropping ~2–3% intraday in response to market weakness. This relative weakness is tied to its high volatility, lower depth relative to BTC/ETH, and sensitivity to network concerns or outages that sometimes plague Solana.
If SOL fails to reclaim the 20-day EMA and close above it with conviction, the path toward $185–$175 remains dangerous. Only by reasserting strength above key resistances could Solana reverse its tide.
5. Market Backdrop: Deleveraging, Regulation, and Sentiment
Deleveraging: The Spark for Rapid Moves
Much of the recent volatility is attributable to a systemic deleveraging event. With over $1.5B in liquidations, long positions were forced to unwind, pressuring prices downward rapidly. Because many traders in crypto are leveraged—and sentiment is often fragile—such events can cascade sharply.
Regulatory Shifts & Institutional Flows
The SEC’s new streamlined rules for crypto ETF approval have spurred a wave of filings. This regulatory clarity (or easing) may attract institutional capital previously sitting on the sidelines. For instance, multi-coin ETFs (including BTC, ETH, SOL, XRP) are in the pipeline.
Still, institutional flows may tend to favor large-cap, well-established assets—making it harder for riskier altcoins to capture new money without differentiation.
Sentiment: Cautious but Watchful
Markets are tightly ranged and sentiment feels nervous. Many participants—especially short-term holders—are skittish. A break below critical thresholds (e.g. BTC below $111,000) could catalyze further downside. Meanwhile, any positive macro signals (such as dovish rate cuts or favorable regulation) might reignite a bullish rip.
Moreover, the market narrative is inching toward maturation: as volatility shrinks, models relying on speculative yield, arbitrage, or staking options may face margin pressure.
6. Broader Trends & Opportunities to Watch in 2025
While price charts matter for timing, structural dynamics will increasingly drive what projects succeed. Here are several of the most consequential trends as we move into the second half of 2025:
6.1 Enterprise Blockchain Adoption
Blockchain is no longer confined to crypto speculation. Major industries—finance, supply chain, healthcare, trade—are selectively integrating blockchain for transparency, provenance, and trusted coordination. Projects that balance permissioned and permissionless attributes, or that anchor on compliance and interoperability, may gain traction in real-world use.
6.2 Regulatory Clarity & Legislative Momentum
Regulators are catching up, especially in developed markets. The U.S. SEC’s ETF rule changes are one example. Globally, clearer frameworks will reduce counterparty risk, open new capital sources (pensions, institutions), and foster sustainable growth rather than boom-bust cycles.
6.3 Cross-Chain Protocols & Interoperability
Projects enabling seamless movement of tokens, data, and liquidity across chains are becoming ever more strategic. Chainlink’s CCIP, for instance, has processed billions in cross-chain volume and is partnering with multiple blockchains. The Graph is integrating CCIP to allow GRT to flow across networks.
These developments reduce “chain risk” and may favor protocols positioned as connective infrastructure.
6.4 Rising Layer-1 and Layer-2 Competitors
Ethereum and Solana may no longer monopolize attention. New chains like Sui (with high throughput and user-centric design) are being spotlighted as serious contenders. Innovations like Avax’s subnet model, chains optimized for gaming or AI, and modular architectures may redefine which platforms capture developer mindshare.
6.5 Tokenization & Real-Asset Bridging
We are seeing a convergence between tokenization of real-world assets (RWAs) and traditional finance. Examples include security tokens, tokenized real estate, carbon credits, or AI-backed asset wallets. The SHHEIKH Token is one such project aiming to fuse AI with real asset tokenization.
6.6 Developer Activity & Ecosystem Health
The “Developer Report” shows that developer contributions, new repos, and on-chain projects remain key barometers of lasting momentum. As speculative cycles fade, sustained growth will hinge on active engineering, tooling, and community support.
Summary & Outlook
Bitcoin is making a bid to reclaim momentum, but stumbling at resistance zones risks opening a slide back to $100K+ zones. Ethereum is caught in a balance: strong support near $4,060, but vulnerable below that line. XRP’s triangle setup is decisive—break or bounce will set its next leg. Solana, however, is in a more precarious position given its sharper slide and weaker base.
Beyond the near-term technicals, 2025 is shaping up as a pivotal year. The interplay among regulatory clarity (especially in the U.S. and major markets), large-scale capital flows (ETFs, institutions), and next-gen infrastructure (interoperability, tokenization, new chains) will be decisive in which projects earn sustainable relevance. For readers hunting for “the next opportunity,” the frontier may lie less in pure momentum plays and more in protocols and systems bridging the old and new worlds.
Over the coming weeks, keep a close eye on (1) macro and Fed cues, (2) BTC support zones around $111K–$112K, (3) ETF filings and capital flows, and (4) cross-chain integrations or real-world asset tokenization announcements. Those who spot strength in the right structural narratives—rather than just chart breaks—may find the next ground-floor opportunity.
