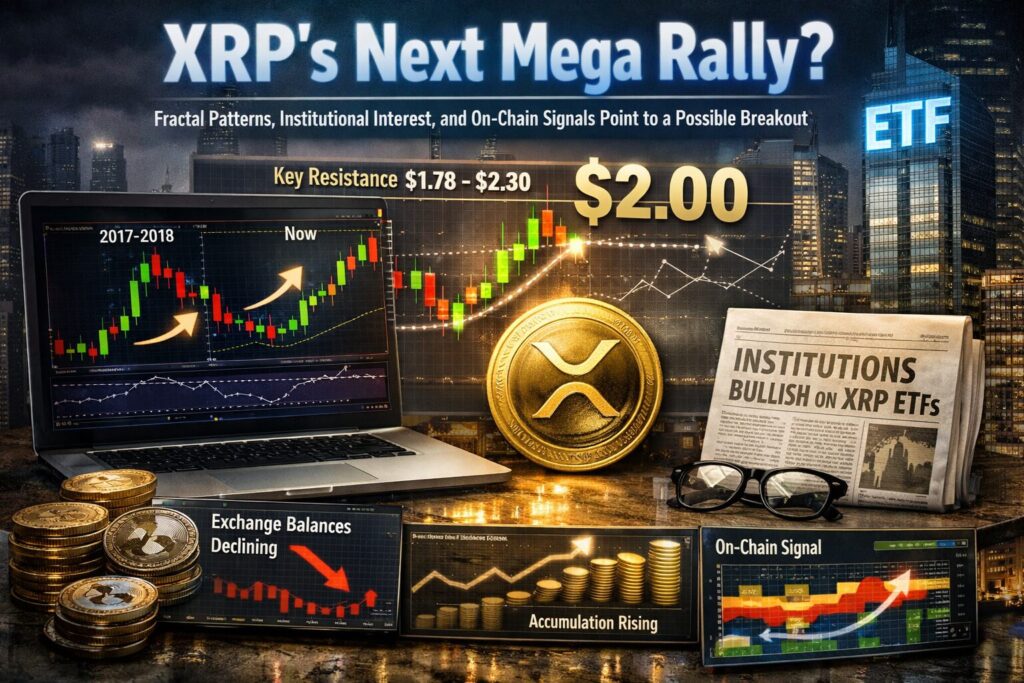
Main Points :
- XRP’s weekly chart is showing a fractal pattern similar to the 2017–2018 bull cycle.
- Analysts believe the current correction could be a temporary consolidation before a major rally.
- Key resistance levels around $1.78–$2.30 must be broken for the next bullish phase.
- On-chain data shows large supply clusters around $1.80 and $2.00, indicating strong resistance.
- Exchange balances are declining, suggesting accumulation and long-term holding.
- Institutional interest is increasing, with major financial institutions appearing among XRP ETF holders.
1. A Familiar Pattern: XRP’s Fractal Resembling the 2017 Bull Cycle
Recent technical analysis suggests that XRP may be entering a phase that resembles the beginning of its historic rally during the 2017–2018 cryptocurrency bull market.
A fractal analysis comparing the 2017–2018 cycle with the current 2024–2026 cycle shows striking similarities. During the earlier cycle, XRP experienced a steep decline before forming a consolidation pattern that ultimately preceded a massive rally.
The current market behavior appears to echo this structure.
After reaching a multi-year high of approximately $3.66, XRP experienced a sharp correction, eventually dropping to around $1.10. Analysts have pointed out that this move mirrors the correction seen in 2017 when XRP fell to approximately $0.12, forming a local bottom before beginning its explosive ascent.
What makes this comparison particularly interesting is the presence of a symmetrical triangle pattern in both cycles.
In technical analysis, symmetrical triangles often represent periods of consolidation where buying and selling pressure gradually converge. These patterns frequently resolve with a powerful breakout once market participants establish a clear directional bias.
Crypto analyst Javon Marks highlighted that if the current fractal continues to develop in a similar way, the ongoing decline could simply represent the final consolidation phase before a major upward movement.
According to his analysis, XRP could potentially move well above $20 in the long term if the pattern unfolds as it did previously.
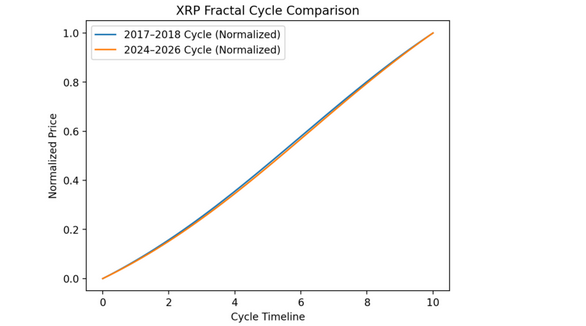
Graph comparing XRP price movement in 2017–2018 vs. 2024–2026 cycles, highlighting the symmetrical triangle pattern and breakout zone.
2. The Critical Breakout Zone: Why $1.78–$2.30 Matters
For XRP bulls, the next phase of the rally depends on whether the asset can break through a cluster of important resistance levels.
Technical analysts identify $1.78–$2.30 as a key resistance zone. Several important indicators converge in this area:
- The upper trendline of the symmetrical triangle
- The 100-week simple moving average (SMA)
- The 50-day moving average
When multiple technical indicators overlap in a single price range, the level becomes psychologically and structurally important.
A sustained breakout above this region would signal that buyers have regained control of the market.
Historical precedent strengthens this argument.
During the 2017 rally, XRP traded within a similar triangular consolidation pattern while the broader market experienced deleveraging. Once the asset broke above the upper trendline, it triggered an explosive 1,577% rally.
If a similar pattern repeats, XRP could enter another rapid appreciation phase once the resistance zone is decisively cleared.
However, until that breakout occurs, the market may remain in a consolidation phase characterized by sideways price movement and periodic corrections.
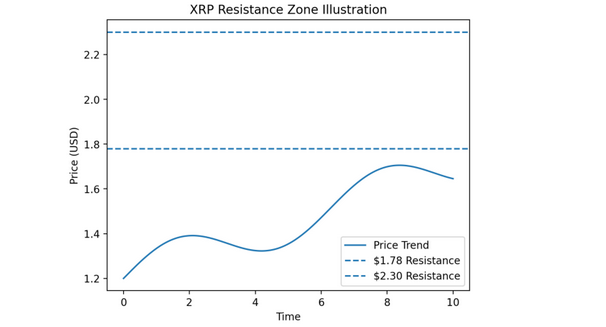
Chart showing the $1.78–$2.30 resistance range, moving averages, and the upper triangle trendline.
3. Supply Clusters and Market Structure: Understanding On-Chain Resistance
Beyond traditional chart analysis, on-chain metrics provide valuable insights into market structure.
One particularly useful indicator is UTXO Realized Price Distribution (URPD).
URPD measures how much of the token supply was last transacted at specific price levels. When large amounts of supply cluster around a price point, those holders may be more likely to sell once the price returns to their break-even levels.
Recent data indicates significant supply concentrations above the current market price:
- 3.6% of XRP supply around $2.00
- 3.15% around $1.80
These supply clusters represent potential sell pressure zones.
If XRP approaches these levels, some investors who bought during previous rallies may choose to exit their positions.
However, once these resistance levels are absorbed by demand, the market structure often becomes significantly more bullish.
In many previous crypto market cycles, clearing major supply clusters has led to rapid price acceleration because fewer holders remain incentivized to sell.
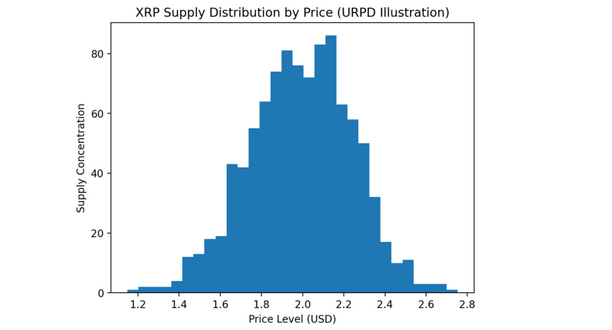
Visualization of XRP supply clusters around $1.80 and $2.00 based on URPD data.
4. Exchange Outflows: A Strong Signal of Accumulation
Another notable trend supporting the bullish thesis is the decline in XRP balances held on cryptocurrency exchanges.
Data from on-chain analytics platforms shows that XRP reserves across major exchanges have been steadily decreasing.
This metric tracks the amount of XRP stored on trading platforms such as Binance, Coinbase, and other centralized exchanges.
Historically, declining exchange balances often signal accumulation behavior.
When investors move assets off exchanges and into private wallets, it typically indicates:
- Long-term holding intentions
- Reduced immediate selling pressure
- Increased investor confidence
According to recent analytics, the net transaction delta across 15 major exchanges has fallen to historic lows.
CryptoQuant analyst Amr Taha noted that such declines typically indicate that investors are withdrawing tokens from exchanges rather than depositing them for sale.
Another analyst, Darkfost, observed a sharp rise in withdrawal transactions from Binance.
For example, on March 6, more than 14,000 withdrawal transactions were recorded on the exchange.
This level of activity suggests that investors may be actively accumulating XRP and transferring their holdings into private wallets.
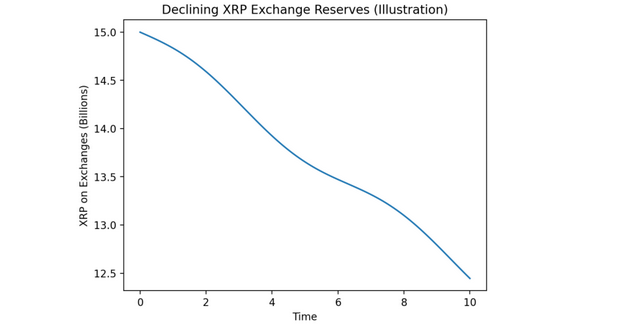
Chart illustrating declining XRP reserves on exchanges since 2021.
5. Exchange Balances Reach a Four-Year Low
As a result of these withdrawals, the total XRP balance stored on exchanges has dropped significantly.
Recent estimates suggest that exchange reserves have fallen to approximately 12.9 billion XRP, the lowest level since May 2021.
From a market perspective, declining exchange reserves can have several implications:
- Reduced liquid supply available for immediate sale
- Increased scarcity during periods of rising demand
- Higher probability of price volatility during bullish phases
In simple terms, when fewer tokens are available on exchanges, a surge in demand can push prices upward more quickly.
This dynamic has been observed repeatedly in previous cryptocurrency bull markets.
For example, similar exchange reserve declines preceded major rallies in Bitcoin and Ethereum during the 2020–2021 cycle.
If XRP follows a similar path, the shrinking supply on exchanges could amplify future price movements.
6. Institutional Interest and the Emerging XRP ETF Narrative
Beyond technical analysis and on-chain data, institutional participation is becoming an increasingly important factor in XRP’s long-term outlook.
Recent developments suggest that institutional investors may be quietly increasing their exposure to XRP-related financial products.
Reports indicate that capital outflows from U.S. spot XRP ETFs have begun to stabilize, signaling that selling pressure may be subsiding.
More notably, Goldman Sachs has reportedly emerged as one of the largest holders of XRP-related ETF positions.
While the XRP ETF market remains significantly smaller than Bitcoin’s ETF ecosystem, institutional involvement represents an important step toward broader adoption.
The presence of major financial institutions can influence market dynamics in several ways:
- Increasing market liquidity
- Enhancing credibility among traditional investors
- Encouraging regulatory clarity
Institutional interest has historically played a major role in accelerating cryptocurrency adoption cycles.
Bitcoin’s surge following the launch of U.S. spot ETFs in 2024 demonstrated how large capital inflows can reshape market trajectories.
If XRP receives similar institutional momentum, the asset could benefit from both increased liquidity and heightened investor awareness.
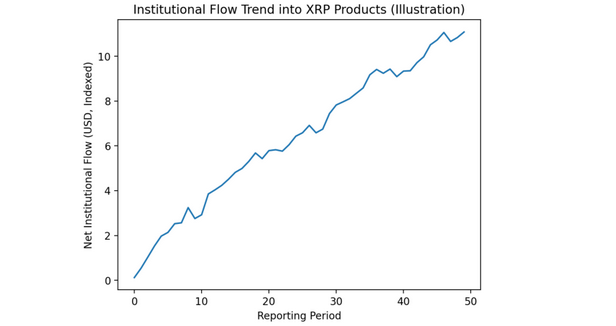
Graph showing institutional flows and ETF holdings related to XRP.
7. Broader Crypto Market Context: Why XRP’s Timing Matters
The potential XRP breakout also coincides with broader shifts in the cryptocurrency landscape.
Several macro trends are shaping the current market cycle:
- Institutional adoption of digital assets
- Expansion of blockchain payment infrastructure
- Growing regulatory clarity in major markets
XRP occupies a unique position within this ecosystem because of its focus on cross-border payment infrastructure.
Ripple’s technology aims to reduce the cost and settlement time of international money transfers, competing with traditional systems such as SWIFT.
In recent years, Ripple has expanded partnerships with financial institutions across Asia, the Middle East, and Latin America.
These developments reinforce XRP’s narrative not only as a speculative asset but also as a utility-driven token within global financial infrastructure.
For investors searching for new crypto opportunities, assets with real-world use cases often attract sustained interest during market expansion phases.
Conclusion: A Critical Moment for XRP
XRP appears to be approaching a pivotal moment.
A combination of technical patterns, on-chain metrics, declining exchange reserves, and increasing institutional attention suggests that the asset may be building the foundation for a new bullish cycle.
The fractal comparison with the 2017 rally offers a compelling narrative, but confirmation ultimately depends on whether XRP can break through the $1.78–$2.30 resistance zone.
If this breakout occurs, it could signal the start of a powerful new phase for the asset.
For investors exploring emerging opportunities in the cryptocurrency market, XRP represents a fascinating case study.
Its potential upside is tied not only to speculative momentum but also to the broader evolution of blockchain-based financial infrastructure.
Whether XRP ultimately replicates its historic rally remains uncertain.
However, the convergence of technical and fundamental signals indicates that the market may be entering one of the most important periods in the asset’s history.
