Main Points :
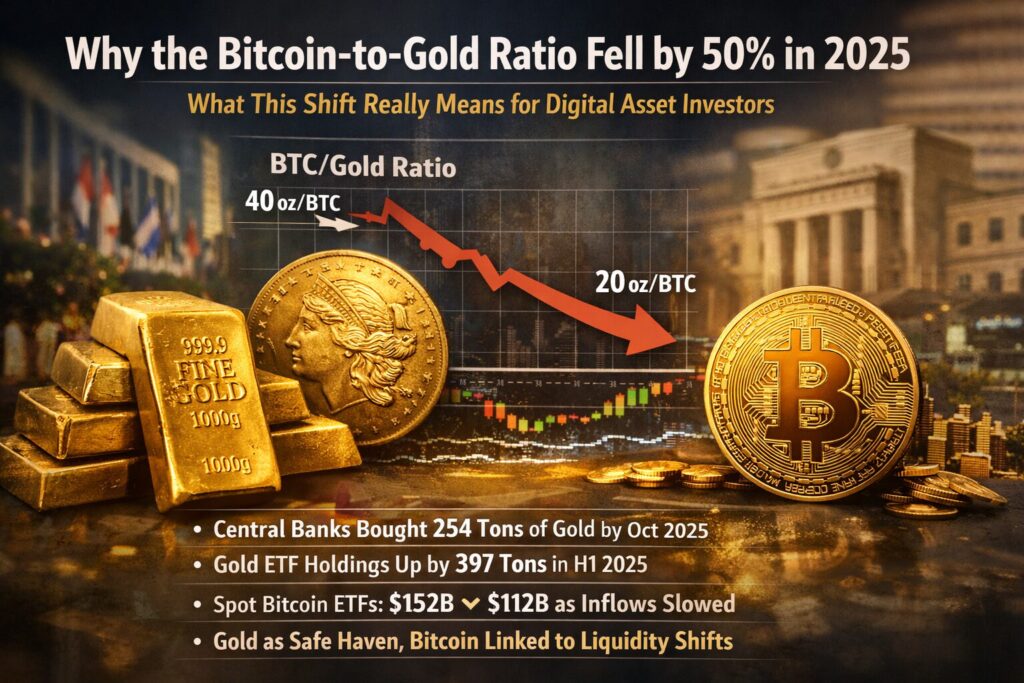
- The Bitcoin-to-gold ratio fell from around 40 ounces per BTC in December 2024 to roughly 20 ounces in Q4 2025, representing a 50% decline
- This decline does not signal a collapse in Bitcoin demand, but rather reflects gold’s exceptional outperformance in a unique 2025 macroeconomic environment
- Central banks purchased 254 tons of gold by October 2025, while global gold ETF holdings increased by 397 tons in the first half of the year
- Spot Bitcoin ETF assets peaked at $152 billion, then declined to around $112 billion as inflows slowed and long-term holders took profits
- Gold functioned as portfolio insurance and reserve collateral, while Bitcoin remained more sensitive to liquidity conditions and opportunity costs
1. Understanding the Bitcoin-to-Gold Ratio
The Bitcoin-to-gold ratio measures how many ounces of gold are required to purchase one Bitcoin. Unlike price charts denominated in fiat currencies, this ratio strips away dollar-based distortions and allows investors to compare relative performance between two competing stores of value.
By late 2024, one Bitcoin could be exchanged for approximately 40 ounces of gold. By the fourth quarter of 2025, that figure had dropped to around 20 ounces, marking a sharp relative underperformance of Bitcoin versus gold.
At first glance, such a move may appear bearish for Bitcoin. However, a deeper analysis reveals that the ratio’s decline was driven far more by gold’s extraordinary strength than by any structural weakness in Bitcoin itself.
2. 2025: A Rare Year Where Gold Dominated as a Store of Value
Gold’s Price Performance
In 2025, gold emerged as the dominant global store-of-value asset. Prices rose 63% year-to-date, breaking above $4,000 per ounce in the fourth quarter. What made this rally remarkable was the macroeconomic backdrop: tight monetary policy.
Throughout most of the year, U.S. policy rates remained elevated, with the Federal Reserve only delivering its first rate cut in September. Traditionally, such conditions are unfavorable for non-yielding assets like gold. Yet gold surged, signaling a fundamental shift in demand drivers.
Central Bank Accumulation
One of the most powerful forces behind gold’s strength was central bank accumulation.
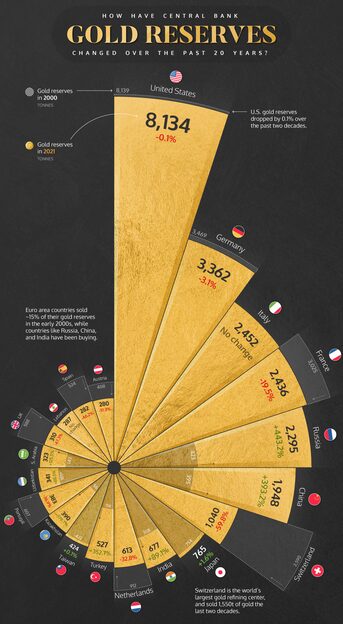
By October 2025, central banks had purchased 254 tons of gold, with the National Bank of Poland alone adding 83 tons. This was not speculative demand—it was strategic reserve accumulation, reflecting growing concerns over currency risk, geopolitical fragmentation, and long-term financial stability.
Gold ETF Inflows
ETF demand reinforced this trend.
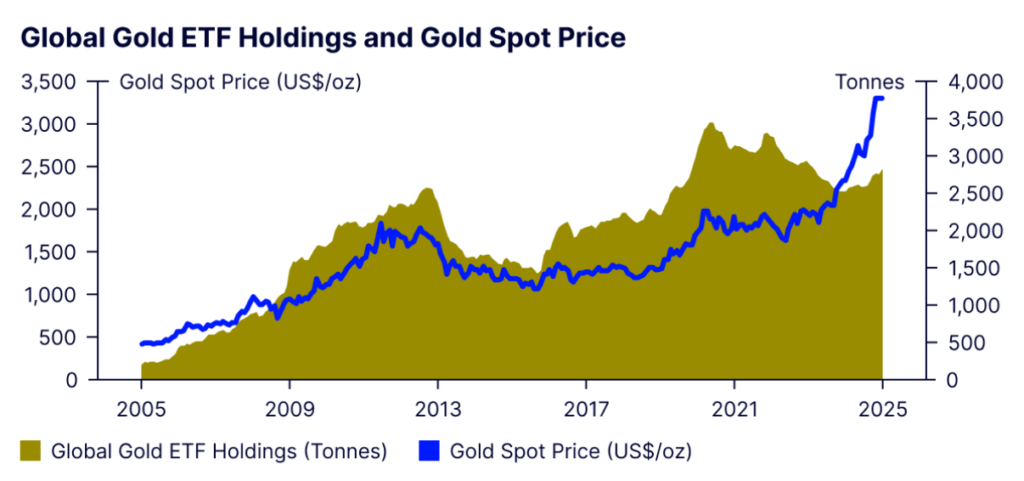
Global gold ETF holdings increased by 397 tons in the first half of 2025, reaching a record 3,932 tons by November. This marked a dramatic reversal from the outflows seen in 2023 and underscored gold’s renewed role as both a risk hedge and a strategic allocation.
Decoupling from Real Yields
Even as real yields in developed markets averaged 1.8% in Q2 2025, gold prices rose 23%, weakening the traditional inverse correlation between gold and real interest rates. This shift highlighted gold’s evolving role—not merely as an inflation hedge, but as systemic insurance.
3. Rising Uncertainty Strengthened Gold’s Appeal
Macroeconomic and geopolitical uncertainty further amplified gold demand.
- The VIX volatility index averaged 18.2 in 2025, up from 14.3 in 2024
- The geopolitical risk index rose 34% year-on-year
- Gold’s equity beta fell to –0.12, its lowest level since 2008
These metrics indicate that gold was increasingly viewed as uncorrelated protection, attracting both defensive capital and long-term institutional allocations.
4. Bitcoin’s Strong Absolute Performance — But Relative Lag
Bitcoin Still Delivered Strong Returns
Bitcoin did not perform poorly in absolute terms. Prices climbed into the six-figure range, supported by growing institutional adoption and the continued expansion of spot Bitcoin ETFs earlier in the year.
However, relative to gold, Bitcoin fell behind.
Spot Bitcoin ETF Dynamics
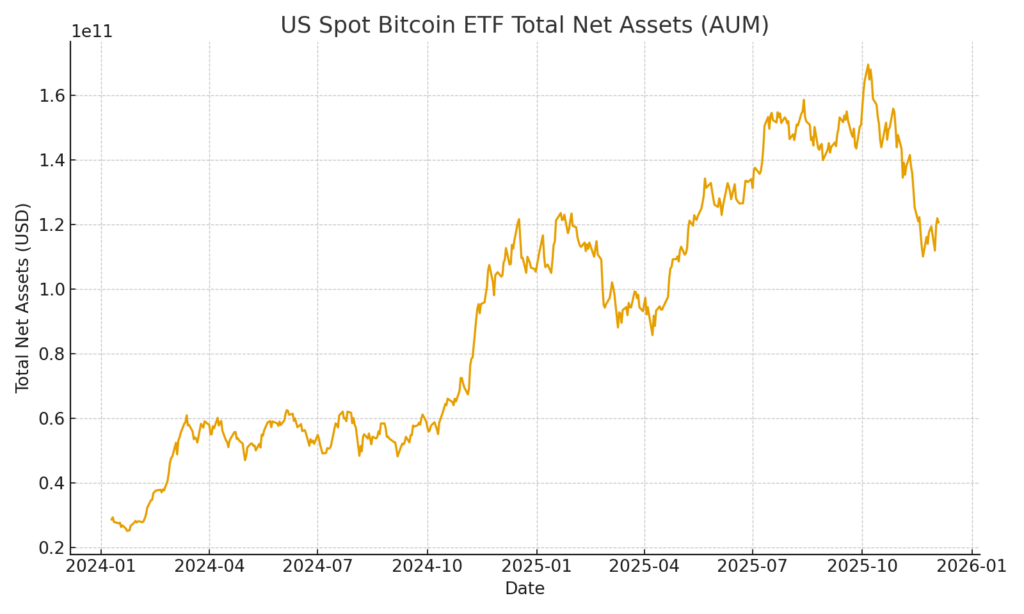
Assets under management in spot Bitcoin ETFs grew from $120 billion in January to a peak of $152 billion in July. Yet over the following five months, AUM declined to approximately $112 billion.
This contraction reflected:
- Profit-taking during price consolidations
- Slower new inflows
- Higher opportunity costs amid elevated real yields
In contrast, gold ETFs continued to attract consistent inflows throughout the same period.
5. On-Chain Data Signals Distribution Phase
Blockchain data further explains Bitcoin’s relative underperformance.
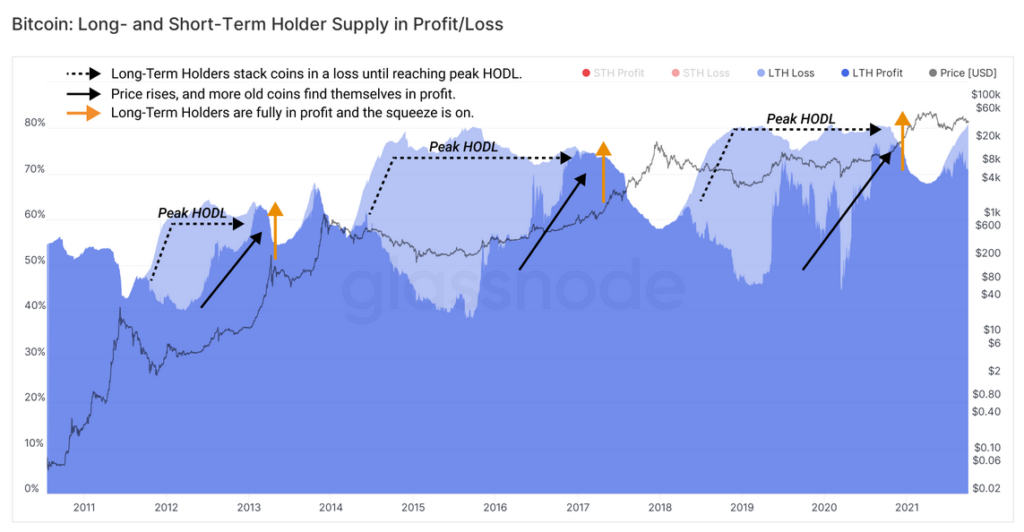
According to Glassnode:
- In July, long-term holders realized over $1 billion per day in profits on a seven-day average basis
- In October, approximately 300,000 BTC (around $33 billion) were sold—the largest distribution since December 2024
- Long-term holder supply declined from 14.8 million BTC in July to around 14.3 million BTC by late 2025
This selling was not panic-driven. Instead, it reflected rational portfolio rebalancing after substantial gains.
6. Opportunity Cost and Correlation Differences
One critical factor shaping the Bitcoin-to-gold ratio was opportunity cost.
- Elevated real yields increased the cost of holding Bitcoin
- Bitcoin maintained a relatively higher correlation with equities
- Gold benefited from both risk-off flows and reserve asset demand
In essence, gold thrived in an environment where liquidity was tight and uncertainty high, while Bitcoin’s upside was constrained by capital discipline and profit realization.
7. What the Ratio Decline Does — and Does Not — Mean
The 50% decline in the Bitcoin-to-gold ratio does not imply that Bitcoin has failed as a store of value. Instead, it reflects a cyclical re-rating driven by:
- Exceptional central bank demand for gold
- Elevated real yields
- Temporary distribution by long-term Bitcoin holders
Historically, Bitcoin’s strongest relative outperformance has occurred during periods of monetary easing and expanding liquidity. Gold, by contrast, excels during periods of systemic stress and institutional risk aversion.
8. Strategic Implications for Digital Asset Investors
For investors seeking new crypto assets, yield opportunities, and practical blockchain applications, several lessons emerge:
- Relative performance matters: Bitcoin and gold serve different roles depending on macro conditions
- Bitcoin remains a high-convexity asset best suited for liquidity-expansion phases
- Gold’s dominance in 2025 reinforces the value of diversified, regime-aware allocation strategies
- Bitcoin’s long-term thesis remains intact, particularly as monetary policy eventually shifts
Conclusion: A Temporary Shift, Not a Structural Defeat
The collapse of the Bitcoin-to-gold ratio in 2025 was not a referendum on Bitcoin’s relevance. It was a reflection of an extraordinary year in which gold absorbed global demand for safety, reserves, and insurance amid prolonged monetary tightness.
As liquidity conditions evolve and institutional adoption of blockchain-based financial infrastructure continues, Bitcoin’s relative position is likely to change again. For forward-looking investors, the key takeaway is not to choose between Bitcoin or gold—but to understand when and why each asset leads.
