Main Points :
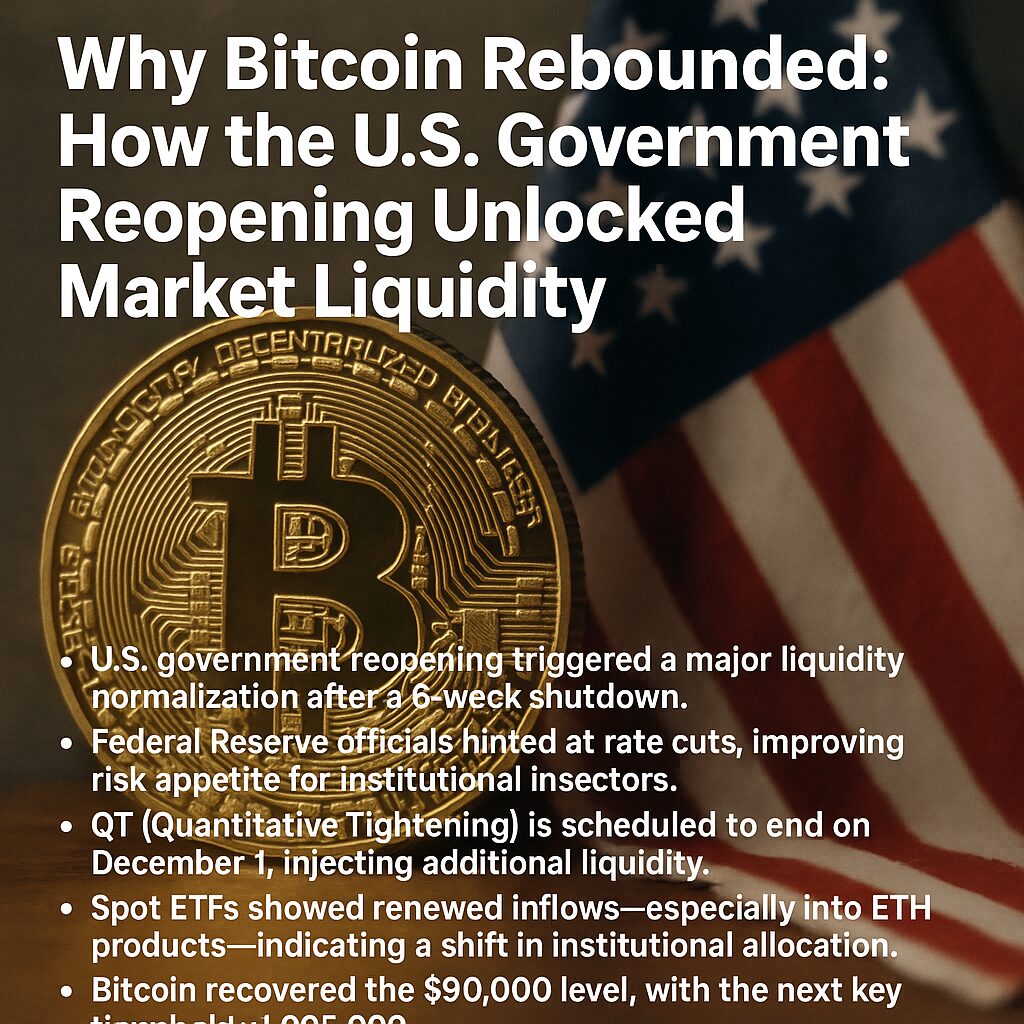
- U.S. government reopening triggered a major liquidity normalization after a 6-week shutdown.
- Federal Reserve officials hinted at rate cuts, improving risk appetite for institutional investors.
- QT (Quantitative Tightening) is scheduled to end on December 1, injecting additional liquidity.
- Spot ETFs showed renewed inflows—especially into ETH products—indicating a shift in institutional allocation.
- Bitcoin recovered the $90,000 level, with the next key threshold at $95,000.
- XRP and BTC flows remained modest while SOL products saw outflows, suggesting risk-balanced repositioning.
- Macroeconomic risks such as inflation data and holiday-season liquidity remain important variables.
Introduction: A Turning Point for the Digital Asset Market
On November 27, the cryptocurrency market staged one of its strongest rebounds in recent months, lifting Bitcoin back above $90,000 and Ethereum above $3,000 for the first time in a week. While this may appear to be a routine price fluctuation, the underlying drivers point to something far more structural: a renewed flow of liquidity into the U.S. financial system following the government’s full reopening after a prolonged shutdown.
Asset managers—including Ark Invest—identified this macro shift as the key catalyst behind the sudden recovery. For investors searching for new digital assets, fresh yield opportunities, or practical blockchain applications, understanding this structural liquidity shift is essential.
Section 1: How the U.S. Government Reopening Restored Liquidity
A 6-Week Shutdown Drained Liquidity Out of the System
During the six weeks when the U.S. federal government was partially shut down, the Treasury General Account (TGA) accumulated large cash buffers while agencies halted spending. This effectively withdrew billions of dollars from circulation, tightening liquidity across all risk markets—including cryptocurrencies.
Historical data shows that Bitcoin tends to underperform during periods when U.S. liquidity falls below trend. The shutdown created precisely such a liquidity compression, dampening institutional trading volumes.
Reopening Reverses Capital Outflows
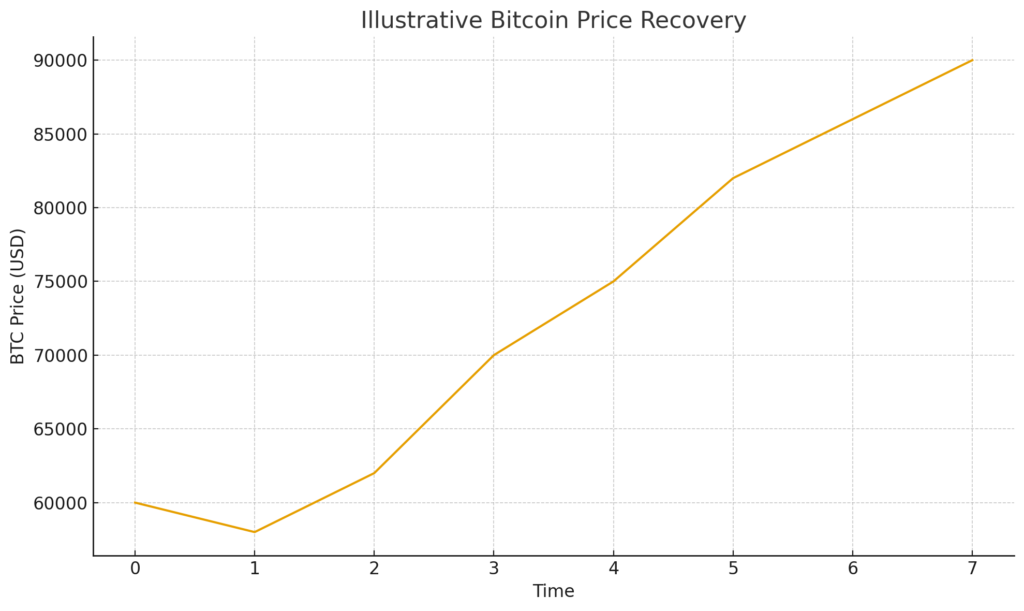
Once the government resumed full operations, previously frozen spending was unlocked and began to flow back into the system. Treasury outlays increased, and the TGA began releasing cash once again.
This liquidity return coincided with Bitcoin’s sharp move back above $90,000, signaling that market-wide capital constraints were easing.(Insert Chart 1 here)
Section 2: Monetary Policy Shifts Strengthen the Rally
Rate-Cut Signals from the Federal Reserve
Several Federal Reserve officials hinted that they are ready to consider rate cuts sooner than previously anticipated. This shift has two effects:
- Improves risk appetite among hedge funds, ETF issuers, and algorithmic allocators.
- Reduces real yields, which historically pushes investors toward Bitcoin’s “digital store of value” narrative.
As rate-cut expectations were recalibrated, Bitcoin’s dominance metrics improved across major exchanges.
The Scheduled End of Quantitative Tightening (QT)
The end of QT on December 1 is viewed as another powerful liquidity injection. QT’s conclusion means:
- The Fed will no longer reduce its balance sheet.
- Market reserves are expected to stabilize or expand.
- Risk assets typically respond positively to balance-sheet neutrality.
Additionally, the combination of TGA outflows and QT cessation creates a rare, synchronized liquidity expansion period.
Section 3: ETF Flows Reveal Institutional Positioning
One of the clearest indicators of institutional behavior is the daily inflow/outflow pattern of spot ETFs. Recent data highlights several important trends:
ETH Leads Inflows for Four Consecutive Trading Days
Unlike Bitcoin and XRP—which saw moderate inflows—ETH-focused ETF products experienced four straight days of net inflows, suggesting:
- Institutions are positioning for Ethereum-based yield opportunities.
- Anticipation of future ETF expansions (e.g., staking-enabled products).
- Renewed interest in ETH as an infrastructure-focused asset, not just a speculative token.
Solana (SOL) Products See Net Outflows
Solana ETFs showed sustained outflows during the same period. Analysts interpret this as:
- A shift from high-volatility assets to more stable large-caps.
- A desire among institutions to reduce speculative exposure during macro uncertainty.
The divergence between ETH inflows and SOL outflows highlights a maturing institutional strategy where capital rotates based on risk-adjusted return expectations rather than pure hype.
Section 4: Liquidity Indicators Support Continued Recovery
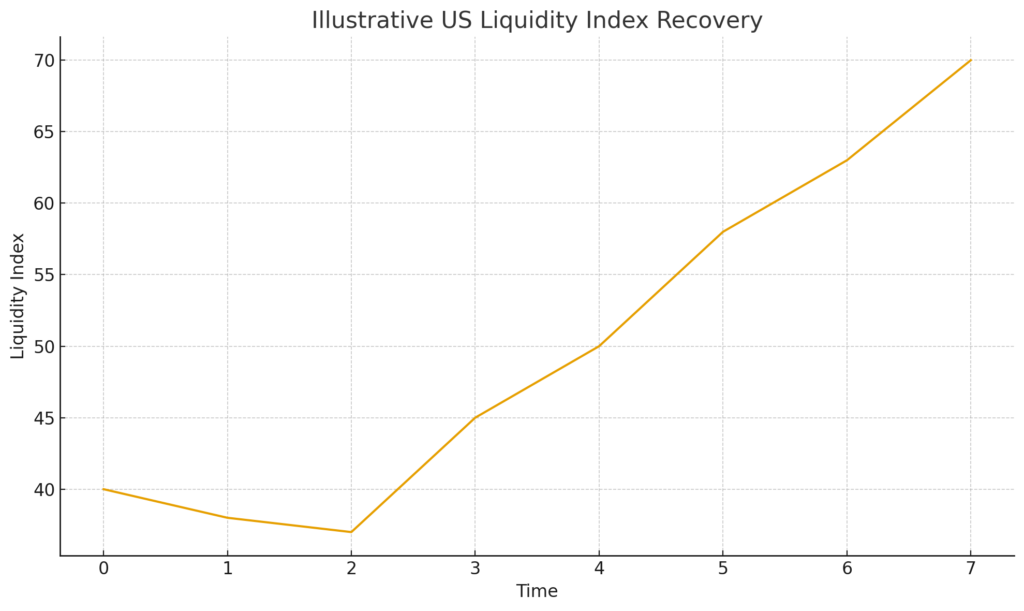
A Rapid Rebound in U.S. Liquidity Indexes
Liquidity indexes tracked by macro analysts turned sharply upward following the government reopening. The rebound reflects:
- Increased Treasury outlays.
- Reduced TGA drawdowns.
- Lower repo facility usage.
- Rising stablecoin market caps (indicating crypto-native liquidity returning).
Section 5: What Investors Should Watch Next
Inflation Metrics
Upcoming inflation reports remain major swing factors. If CPI or PCE data declines faster than expected, the probability of rate cuts will strengthen, further boosting Bitcoin.
Holiday Season Liquidity Decline
Every December, markets naturally experience decreased liquidity due to:
- Institutional holidays
- Reduced market-making activity
- Lower cross-exchange arbitrage volumes
This means volatility may spike even if fundamental demand remains intact.
Whale Behavior
Large wallet inflows/outflows into exchanges will also matter. Increased whale accumulation has historically preceded Bitcoin’s strongest rallies.
Section 6: Can Bitcoin Break Above $95,000?
Bitcoin’s recovery above $90,000 has turned this level into a short-term support. The next critical resistance lies at $95,000.
To break above this level, BTC likely needs:
- Continued ETF inflows
- Stable macro liquidity
- No negative surprises from inflation or Fed communications
- Continued risk-on appetite from institutional allocators
If these conditions hold, Bitcoin could advance toward psychological resistance levels near $100,000 in early 2026.
Conclusion: Why This Recovery Matters
The recent rebound is more than a simple market bounce—it reflects structural liquidity returning to the U.S. financial system following the government reopening and policy shifts from the Federal Reserve. ETF flows show a sophisticated adjustment among institutional investors, with ETH benefiting most from renewed inflows.
For investors seeking new digital asset opportunities, yield-generating strategies, or real blockchain utility, this moment signals the beginning of a potentially sustained liquidity cycle—one that may support Bitcoin’s next attempt at new all-time highs.
