Main Points :
- Bitcoin has decisively broken below a key on-chain support band that previously acted as a floor during the bull market.
- On-chain realized price metrics suggest the next major support zone lies between $60,000 and $70,000.
- U.S. spot Bitcoin ETFs have shifted from strong net buying in 2025 to net selling of roughly 15,000 BTC in 2026, exerting sustained sell pressure.
- The Coinbase price premium has remained negative since mid-October, indicating weakened participation from U.S. investors.
- Stablecoin liquidity, particularly USDT, is contracting for the first time since late 2023, signaling reduced risk appetite.
- While on-chain and liquidity indicators remain bearish, historical cycle analysis suggests the broader crypto winter may be approaching its later stages.
1. Bitcoin Breaks Below a Critical On-Chain Support Line
Bitcoin’s recent price action marks a structurally important shift. According to the latest weekly market report from CryptoQuant, Bitcoin has fallen below a critical on-chain support level that had consistently acted as a demand floor during the current bull cycle.
This support band is derived from traders’ on-chain realized price, a metric that reflects the average acquisition cost of actively traded coins. Historically, this band has functioned as both support and resistance depending on market regime. During bullish phases, dips toward the lower bound often attracted buyers, leading to rebounds.
However, CryptoQuant notes that Bitcoin has now tested this band three times and failed to reclaim it. The most recent breakdown is particularly significant because the lower bound of this realized price range had acted as a reliable support throughout much of the uptrend. Its failure suggests a transition from accumulation to distribution.
From a market-structure perspective, this is less about short-term volatility and more about a shift in who controls marginal supply. When price trades below the average realized cost of active traders, those participants are statistically underwater, increasing the probability of defensive selling.
2. The $60,000–$70,000 Zone as the Next Structural Target
With the prior support broken, CryptoQuant’s analysis points to the $60,000–$70,000 range as the next major support zone. This area aligns with multiple converging signals:
- Historical consolidation zones from earlier in the cycle
- Long-term holder realized price clusters
- High-volume nodes visible in on-chain distribution data
These zones are not arbitrary price targets. They represent areas where significant amounts of Bitcoin previously changed hands, meaning many investors have a psychological and economic incentive to defend these levels.
If Bitcoin enters this range, two scenarios become plausible. In a constructive case, long-term holders step in, absorbing supply and forming a durable base. In a more bearish scenario, failure to hold this zone could trigger a deeper retracement, especially if liquidity conditions continue to deteriorate.
3. U.S. Spot Bitcoin ETFs: From Demand Engine to Selling Pressure
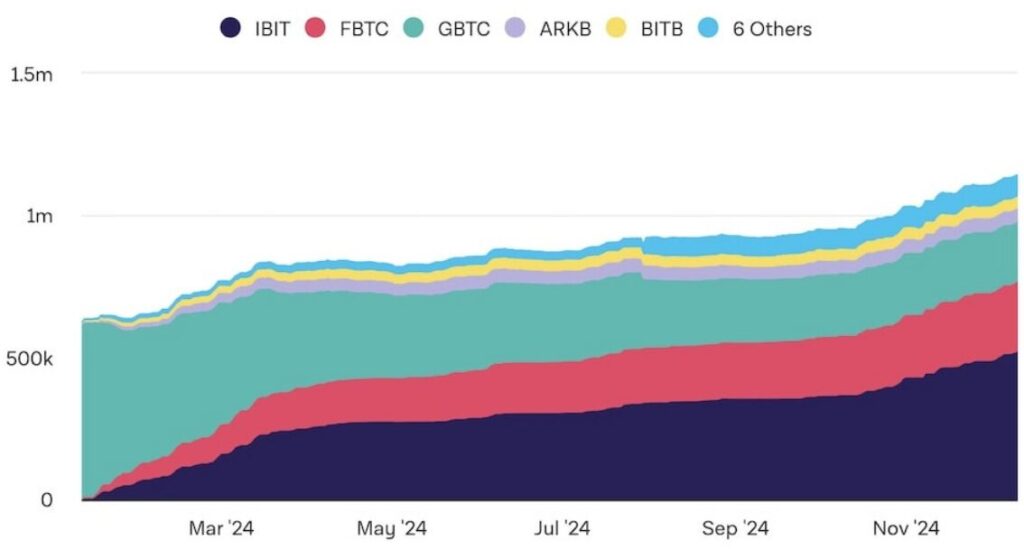
One of the most important shifts highlighted in CryptoQuant’s report concerns U.S. spot Bitcoin ETFs. After acting as a powerful demand engine throughout much of 2025, these products have turned into a net source of selling in 2026.
CryptoQuant estimates that U.S. spot ETFs have recorded net outflows of approximately 15,000 BTC year-to-date. This contrasts sharply with the same period in 2025, when ETFs were net buyers. The year-over-year demand gap is estimated at 62,000 BTC, a material difference in a market where marginal flows often determine price direction.
Spot Bitcoin ETFs allow investors to gain exposure to Bitcoin without directly holding the asset. While this structure lowers barriers to entry, it also introduces a more traditional investor base—one that is often more sensitive to macro conditions, interest rates, and portfolio rebalancing.
As risk-free yields remain attractive and broader financial markets exhibit volatility, some ETF investors appear to be reducing exposure. This behavior reinforces downside pressure, particularly when organic on-chain demand is already weakening.
4. The Coinbase Premium Signals Weak U.S. Participation
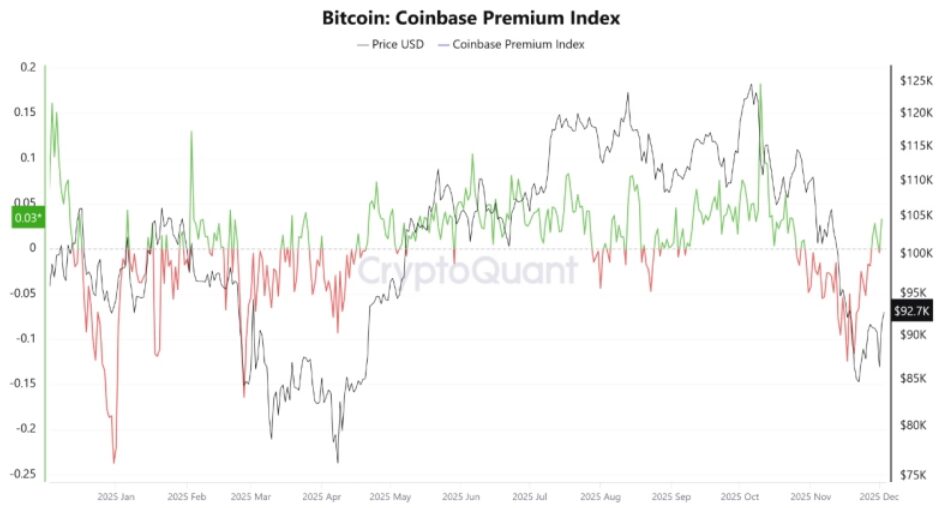
Another telling indicator is the Coinbase premium, which measures the price difference between Bitcoin on Coinbase (a proxy for U.S. investor demand) and offshore exchanges.
Since mid-October of last year, this premium has remained consistently negative. Historically, sustained bull markets in Bitcoin have coincided with a positive Coinbase premium, reflecting aggressive spot buying from U.S.-based institutions and high-net-worth investors.
The absence of such a premium suggests that U.S. participation is muted. This matters because previous bull cycles were often driven by U.S. demand acting as a marginal buyer of last resort. Without that demand, rallies tend to be weaker and more easily reversed.
In practical terms, this means that even positive news or short-term momentum may struggle to translate into sustained upside unless U.S. demand re-enters the market.
5. Liquidity Is Shrinking: Stablecoin Supply Sends a Warning
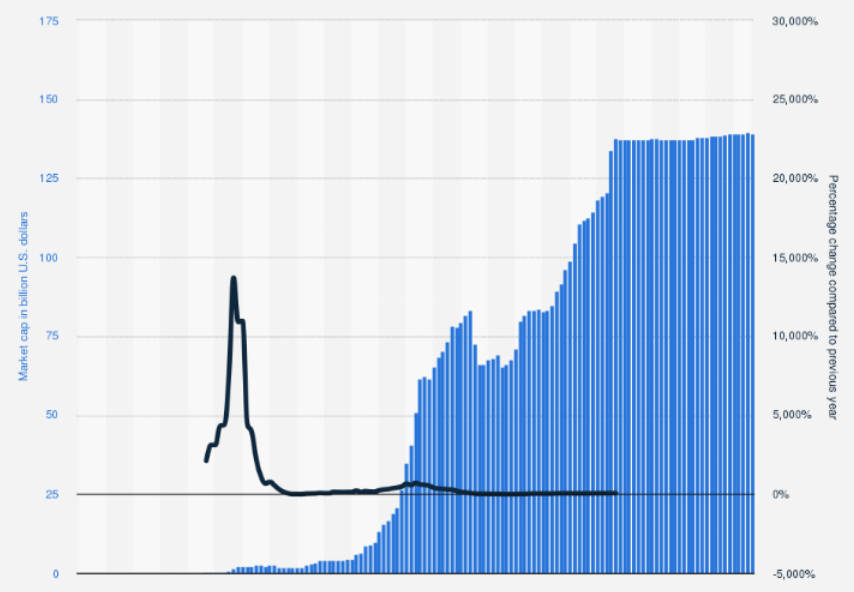
Liquidity conditions are another critical piece of the puzzle. CryptoQuant highlights that the 60-day change in USDT market capitalization has turned negative, declining by approximately $133 million. This marks the lowest growth rate since October 2023.
Stablecoins function as the primary settlement and liquidity layer of the crypto market. When their supply expands, it typically indicates fresh capital entering the ecosystem. Conversely, contraction often accompanies risk-off behavior and deleveraging.
USDT supply growth peaked at around $15.9 billion in late October 2025. The subsequent decline aligns closely with broader bearish price action across crypto assets. For traders and builders alike, this contraction suggests reduced speculative appetite and tighter funding conditions.
From a practical standpoint, shrinking stablecoin liquidity often leads to thinner order books, wider spreads, and increased volatility—conditions that favor short-term traders but challenge long-term investors.
6. Annual Bitcoin Demand Growth Has Collapsed
Perhaps the most striking data point in CryptoQuant’s report is the collapse in annual Bitcoin demand growth. On October 7 of last year, estimated annual demand growth stood at approximately 1.1 million BTC. As of February 4, this figure has fallen to around 77,000 BTC, representing a 93% decline.
This metric captures net absorption of new supply across exchanges, ETFs, and on-chain flows. Such a sharp contraction suggests that the demand expansion phase of the current cycle has already passed.
In past cycles, Bitcoin prices tended to struggle once demand growth plateaued or reversed, even if long-term fundamentals remained intact. This does not necessarily imply a catastrophic collapse, but it does suggest that easy upside driven by expanding participation is no longer available.
7. A Contrasting View: Is the Crypto Winter Near Its End?
Despite the overwhelmingly bearish tone of on-chain and liquidity data, not all analysts share a pessimistic outlook. Bitwise Chief Investment Officer Matt Hougan recently argued that the crypto winter may be closer to its end than its beginning.
Hougan points to historical patterns following the 2017 and 2021 peaks, where Bitcoin tended to bottom roughly 13 months after reaching cycle highs. If this pattern holds, the worst phase of the bear market for retail investors may already be behind us—or nearing completion.
This perspective does not contradict CryptoQuant’s data but reframes it. Structural weakness and late-cycle fatigue can coexist with long-term accumulation opportunities, particularly for investors focused on multi-year horizons.
8. What This Means for Investors and Builders
For investors searching for the next source of returns, the current environment demands selectivity and patience. Momentum-driven strategies that thrived during periods of expanding liquidity are less effective when capital is contracting.
However, for builders and practitioners interested in practical blockchain use cases, periods like this often prove fertile. Reduced speculation tends to shift focus toward infrastructure, payments, stablecoin settlement, and real-world asset integration—areas that continue to see steady development regardless of price.
From a portfolio perspective, the $60,000–$70,000 zone may represent not just a technical level, but a psychological inflection point. How Bitcoin behaves there will likely shape sentiment for the remainder of the cycle.
Conclusion: A Market at a Crossroads
Bitcoin is currently navigating a complex intersection of weakening demand, shrinking liquidity, and shifting investor behavior. On-chain data from CryptoQuant paints a cautious picture, with multiple indicators aligning toward continued downside risk and a potential test of the $60,000–$70,000 support zone.
At the same time, historical cycle analysis reminds us that markets often feel most pessimistic near turning points. Whether this phase resolves into a prolonged consolidation or a deeper correction will depend largely on liquidity conditions and the return—or absence—of U.S. demand.
For those seeking new crypto assets, yield opportunities, or practical blockchain applications, this is not a time for complacency—but neither is it a time for despair. It is a time for disciplined analysis, strategic positioning, and long-term thinking.
