
Main Points :
- A whale sold 24,000 BTC (~$160 million), triggering a rapid ~$4,000 price decline.
- Despite this, Bitcoin Vector’s structural indicator has flipped bullish, though momentum remains weak.
- Ethereum is showing signs of breaking toward $5,000, marking a possible altcoin resurgence.
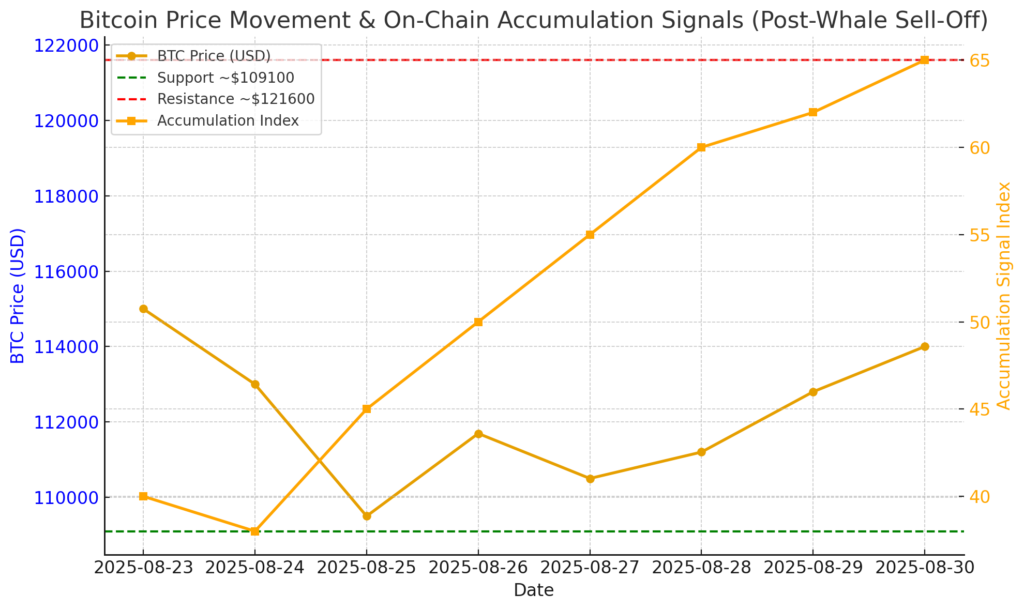
- On‑chain and technical signals suggest a possible accumulation comfort zone near $109,100 support and resistance at $121,600.
- Broader context: whale accumulation trends, ETF flows, and exchange metrics suggest mixed but potentially optimistic outlook over coming months.
1. Whale Liquidation Sends Shockwaves—But Structure Signals Shift
At the close of last week, a longstanding holder—described as a “whale”—sold 24,000 BTC, valued at approximately $160 million (assuming ~$6,700 per BTC), offloading the entire holding through the exchange Hyperunite. This triggered a sharp drop of about $4,000 in Bitcoin’s price within minutes. The seller’s wallet had been dormant for over five years and, although half of the holding was just liquidated, the whale still retains approximately 152,874 BTC.
According to Timechain Index founder Sani, 12,000 BTC of that were sent on Sunday, and the remaining position remains largely in place.
Despite this dramatic capitulation, analysis from Bitcoin Vector highlights that structure‑shift indicators have turned bullish again, suggesting potential for trend reversal. Still, short‑term momentum remains negative.
2. Price Levels: Support at ~$109,100, Resistance at ~$121,600
Bitcoin Vector analysis sets the current support line at $109,100 and resistance around $121,600. In line with this, Investopedia reports that Bitcoin has dropped below $110,000—its lowest since early July—but that support near $107,000 could become a floor, while resistance at $117,000 and $123,000 are key upside levels to watch. Another perspective warns that current price action may be forming a bull trap, with RSI divergence indicating waning momentum.
3. Altcoins on the Move: Ethereum Eyes $5,000 Breakout
The Altcoin Vector analysis suggests Ethereum is reversing downward pressure and targeting $5,000, which acts as more than just resistance—it’s described as a “breakout wall”. Surpassing that level could unlock the next phase of upside, though it also forms a profit‑taking zone.
Crypto markets remain in a defined alt‑season, but despite Bitcoin holding above support, altcoin impulses have not yet gained traction. Currently, capital rotation is largely concentrated on ETH and a few select altcoins. A stronger Bitcoin recovery may trigger broadening impulse across the altcoin sector, converting relative strength into broader market momentum.
4. Whale Behavior—Signals of Accumulation, Not Distribution
Contrasting with the recent sell-off, broader on-chain behavior shows whales accumulating or moving BTC into cold storage rather than selling. One recent report finds on‑chain metrics—including decreased spent volume and low exchange reserves—point to coordinated accumulation, possibly setting the stage for a 30–50% price surge within six to twelve months. Institutional adoption, especially via ETFs, may further reinforce this trend.
Another recent narrative from the July “whaling season” highlights massive realized profits—one whale selling 80,000 BTC for $9.6 billion, originally acquired for minimal cost in 2011; another sold a similar amount acquired in 2014 for a multi‑billion‑dollar profit. These point toward long-term holders exiting and raising speculation about future sell pressure.
5. Caution from Technicals and ETF Outflows
Technical vulnerabilities persist. MarketWatch reports a plunge from around $117,400 to $111,178, with strong selling pressure attributed to the whale and ETF outflows. Ethereum, by contrast, has surged in August but is now pulling back; BTC retail demand appears to be declining.
Margex analysis shows BTC breaching below $111,600, facing additional downward risk if it closes beneath its 100-day EMA (~$110,865), potentially heading toward the 200-day EMA near $103,688. Meanwhile, re: technical caution, Decrypt highlights that the sell-off triggered cascading liquidations, and charts now flash warning signs for BTC, though Ethereum remains comparatively resilient.
6. Broader Market Dynamics: Exchange Flows, Retail Behavior, ETF Influence
Sentiment analysis shows mixed signals: CryptoQuant data indicates a $676 million split in BTC volume shifting toward Binance spot buyers—suggesting retail interest—but analysts caution this may be setting traps by institutions. Brave New Coin notes that whale selling, ETF redemptions, and technical frailty point to caution around the $110,000 support zone, though institutional inflows and halving expectations may offer resilience.
7. Summary Table Suggestion
Insert Visual: A clear chart depicting Bitcoin price movement post-sell-off, support/resistance levels, and accumulating on-chain metrics.
Conclusion: Navigating Opportunity Amid Volatility
In summary, the recent whale liquidation triggered sharp volatility and downward pressure in Bitcoin, but deeper structural indicators now suggest a potential bullish shift. Key chart levels—$109,100 support and $121,600 resistance—will be vital to monitor as momentum and ETF flows evolve.
Ethereum’s approaching $5,000 breakout point could herald a broader altcoin resurgence if BTC stabilizes. Meanwhile, contradictory signals—from whale accumulation on-chain to large realized gains and ETF flows—demand a balanced, cautious but opportunistic mindset.
For those seeking new crypto opportunities or practical blockchain use cases, the current environment offers both risks and openings. Aligning capital with on-chain signals and technical triggers, while staying vigilant around macro and ETF dynamics, could be a rewarding strategy as we head into Q4 2025.
