Main Points :
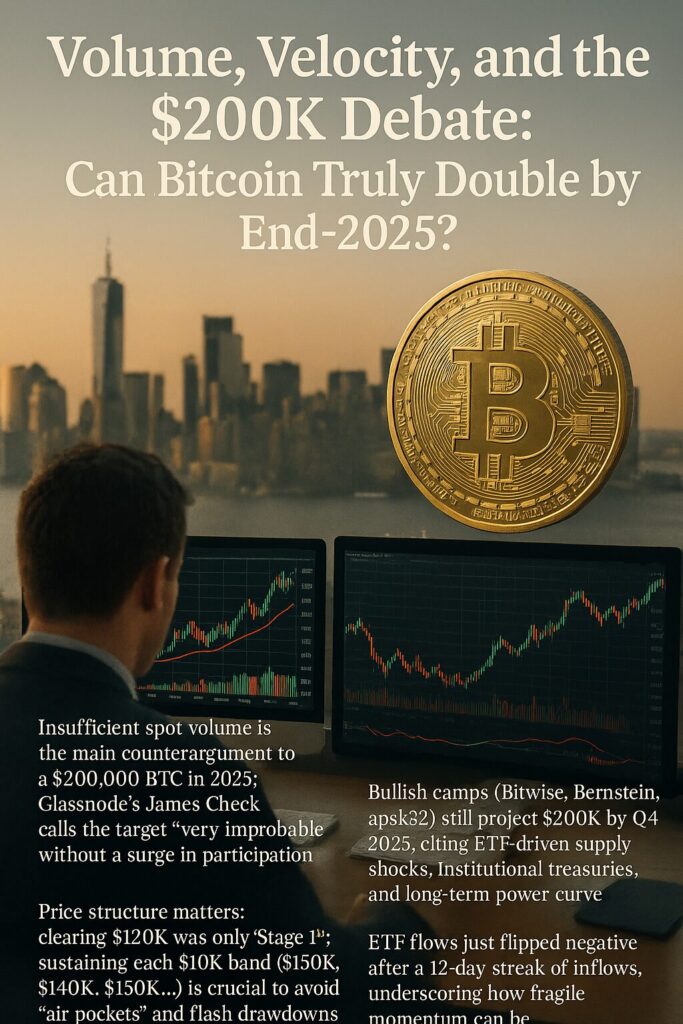
- Insufficient spot volume is the main counterargument to a $200,000 BTC in 2025; Glassnode’s James Check calls the target “very improbable” without a surge in participation.
- Bullish camps (Bitwise, Bernstein, apsk32) still project $200K by Q4 2025, citing ETF-driven supply shocks, institutional treasuries, and long-term power-curve trendlines.
- Price structure matters: clearing $120K was only “Stage 1”; sustaining each $10K band ($130K, $140K, $150K…) is crucial to avoid “air pockets” and flash drawdowns.
- ETF flows just flipped negative after a 12‑day streak of inflows, underscoring how fragile momentum can be.
- Cycle timing risk: If 2020’s pattern repeats, upside could fade within months (around October 2025), per Rekt Capital.
- Macro & micro drivers to watch: Fed rate cuts (liquidity), altcoin rotations, L2 and stablecoin growth, miner economics post‑halving (Apr 20, 2024).
- Actionable angles for builders/investors: hunt for under‑researched assets benefiting from Bitcoin’s liquidity tide, real-yield DeFi, and enterprise blockchain pilots that convert hype into recurring cash flows.
1. Setting the Stage: A Market Split Between Euphoria and Skepticism
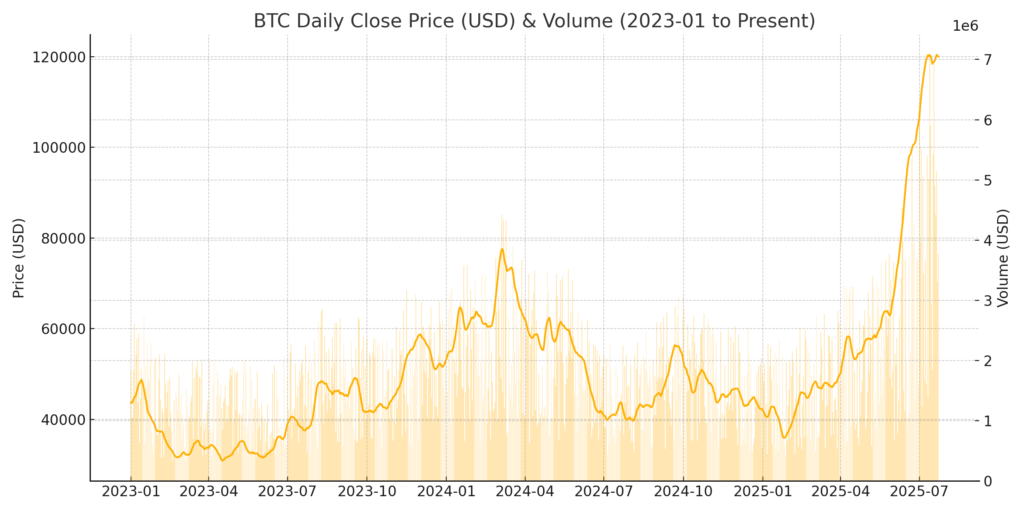
Bitcoin (BTC) sits near all-time highs—hovering around the $118K–$123K band after piercing $120K and briefly tagging $123K+ earlier this month. Yet the community is fractured: some see $200,000 by December 2025 as baseline, others warn the math just doesn’t add up unless volumes and broader demand accelerate meaningfully. Glassnode’s James Check distilled the bear case succinctly: “How can we go up on this volume?” He deems a near‑doubling of market cap in five months “extremely unlikely,” though not impossible.
Institutional inflows, record ETF participation, and growing corporate treasuries feed the bull thesis. But in the last few sessions, U.S. spot ETFs printed net outflows—$131M Monday, $199M cumulatively this week—snapping a 12‑day inflow streak and reminding traders how quickly sentiment can flip.
BTC daily candlesticks + volume, Jan 2023–Present. Small inset zoom on Apr 2024–Present
2. The $200K Camp: Supply Shocks, Power Curves, and “Conservative” Targets
Bitwise CIO Matt Hougan argues a “supply shock” is underway: ETF and treasury demand is outstripping post‑halving issuance, driving a structurally higher floor. Bernstein Research has held its $200K year‑end 2025 call since October 2024 and even labels it “conservative,” citing ETF expansion and corporates adding BTC to balance sheets. On Crypto X, apsk32 extrapolates past log/power curves, expecting $200K+ in Q4 2025 when scaled over two‑year windows, suggesting the macro trend remains intact.
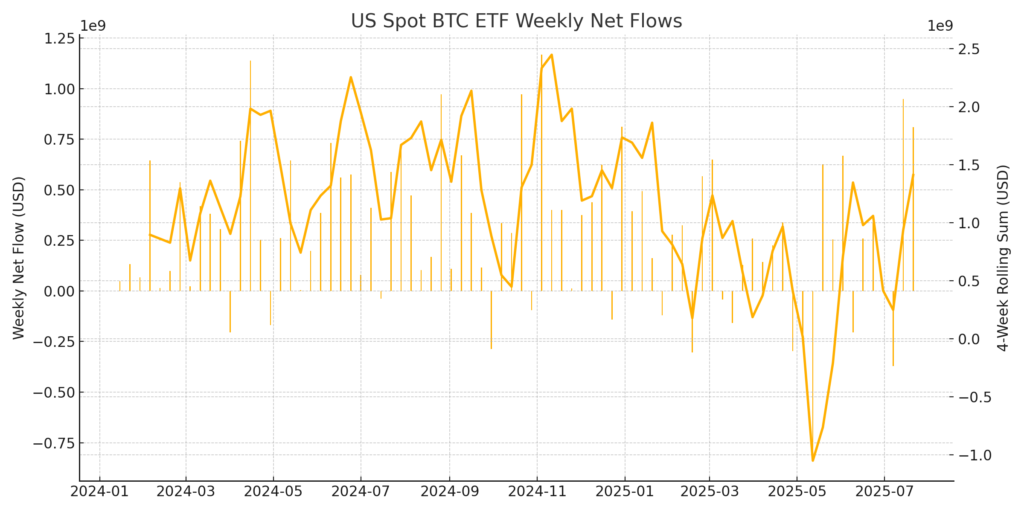
These forecasts lean on the idea that price is a lagging indicator of structural demand. As institutions settle in—spreading buys over quarters, not days—the impulse rallies may feel slower, but the “bid” is deeper. Indeed, ETF data show multi‑billion dollar monthly inflows (e.g., $3.4B in July, $2.2B in just two days) and record open interest in futures ($57.4B).
Weekly net flows of U.S. spot BTC ETFs, stacked bars with rolling sum line
3. The Skeptics: Volume, Market Structure, and Air Pockets
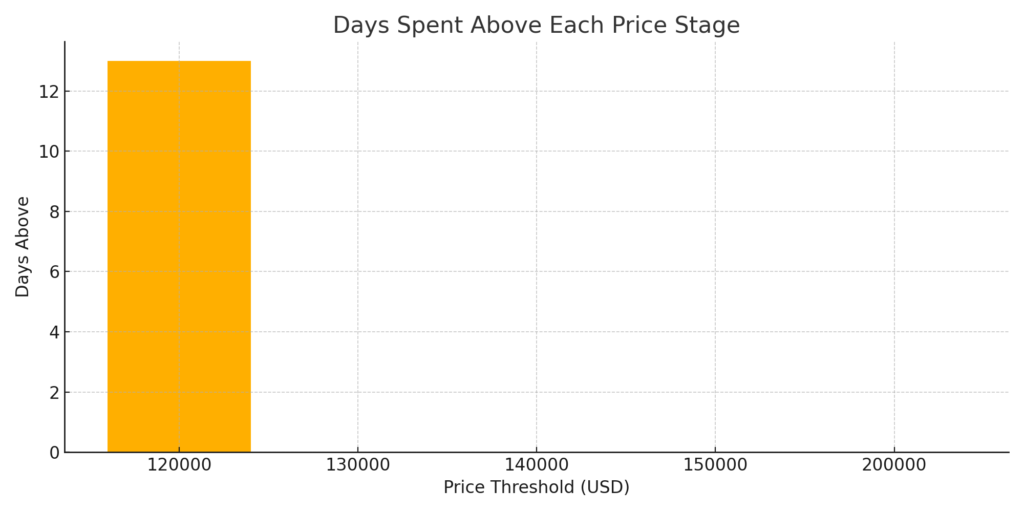
James Check’s caution centers on breadth and durability. It’s one thing to spike through resistance; it’s another to hold those levels. He frames $120K (cleared on July 14) as “Stage 1,” with multiple “stairs” left: $130K, $140K, $150K—each requiring sustained volume and bid support. Without that, the market “flies through the air” and can fall just as fast. Liquidity gaps create brutal downside “air pockets,” especially if leverage quietly builds.
The pullback in ETF flows this week bolsters the cautionary tone. Network activity (active addresses) is dipping, and Google Trends shows retail still lukewarm. If the crowd hasn’t arrived, who fuels the next leg?
Rekt Capital adds a timing risk: if 2020’s cycle is the template, we may be entering the late‑stage expansion phase that historically lasts “a few more months.” He pins a potential peak around October 2025—~550 days after the April 20, 2024 halving.
Step chart showing BTC “stages” $120K→$200K, with bars indicating days spent above each threshold
4. Macro Liquidity: Fed Cuts, Dollar Strength, and Risk-On Rotations
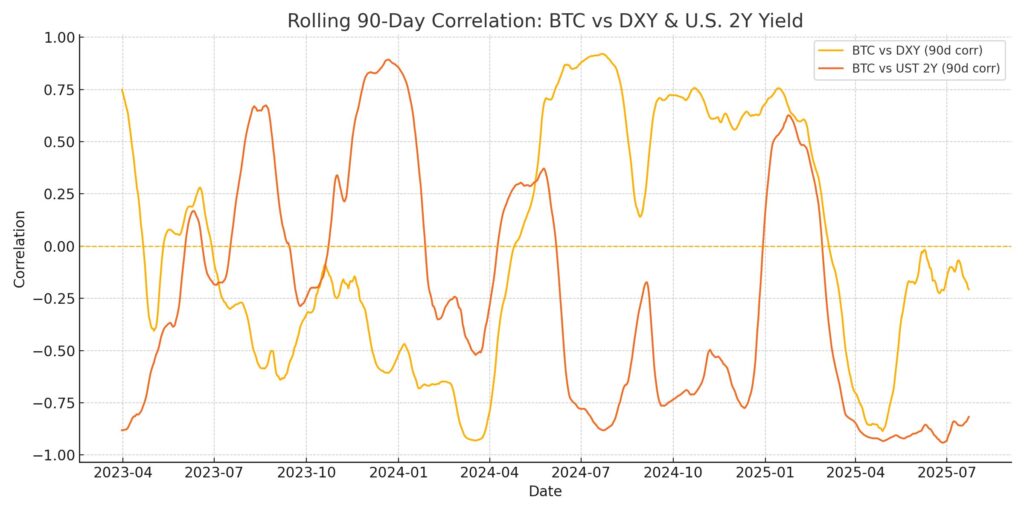
Macro matters. Should the Federal Reserve pivot to rate cuts into late 2025, global liquidity could boost all risk assets—including BTC. Conversely, renewed inflation pressure (e.g., from tariffs or supply shocks) could lift yields and sap momentum. Bitcoin’s correlation with the dollar (DXY) and real yields fluctuates, but risk-on liquidity waves help.
BTC vs. DXY or 2Y UST yield correlation (rolling 90‑day)
5. Post‑Halving Miner Economics: Fees, Hashrate, and Sell Pressure
The April 20, 2024 halving slashed block rewards to 3.125 BTC, compressing miner revenues. With price high, many miners are profitable, but transaction-fee dependence grows. Sustained on-chain activity (Ordinals, L2 settlement, rollups anchoring to L1) can ease sell pressure. A lull in fees could push marginal miners to liquidate holdings—an often overlooked source of supply.
6. Beyond Bitcoin: Where to Hunt for the “Next Revenue Stream”
Your audience seeks new assets and practical blockchain plays. Three actionable veins:
6.1 ETF Halo Effect & “Second-Order” Trades
- Ether ETFs are attracting capital ($296.5M Monday), while alt attention rises as BTC consolidates. CoinDesk Projects directly benefiting from ETH liquidity (L2 rollups, restaking protocols, high‑throughput chains tapping Ethereum settlement) deserve attention.
6.2 Stablecoin & L2 Infrastructure Growth
- Stablecoin float (USDT, USDC) is again expanding, greasing DeFi’s wheels. L2 TVL growth implies fee-paying users and real cash flows (sequencer revenue). (Inference based on broader market data; monitor official dashboards and analytics providers.)
6.3 Real-World Asset (RWA) & Payments Rails
- Tokenized treasuries and payment networks (e.g., enterprise pilots in remittances, payroll, trade finance) are moving from POC to production. Builders who solve compliance (Travel Rule, AML) and UX gaps can capture recurring B2B revenue.
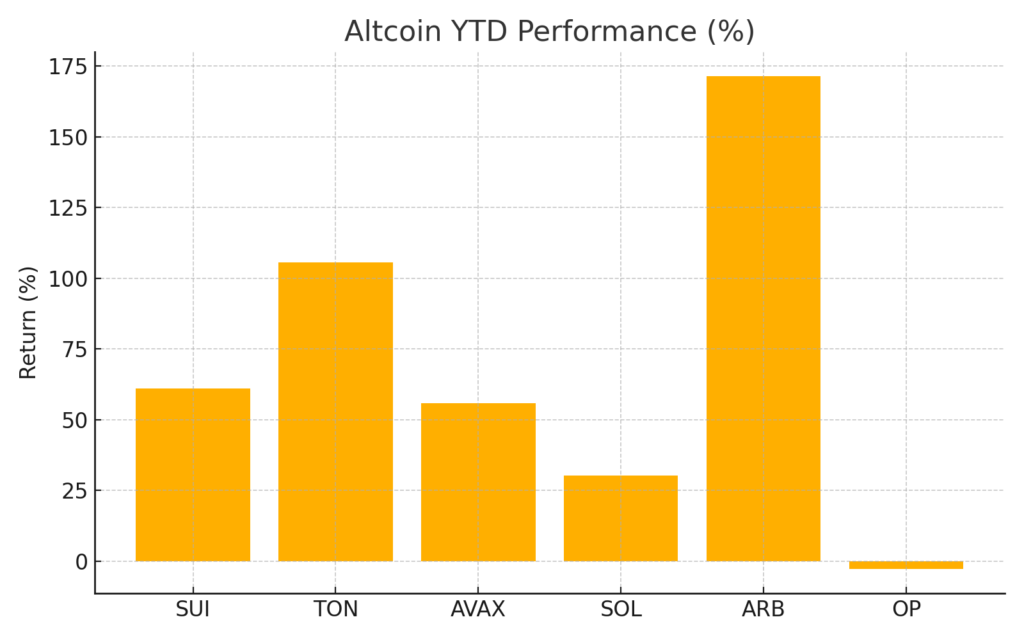
Altcoin YTD performance bars (SUI, TON, AVAX, etc.) or Stablecoin supply curve
7. Strategy: Navigating a High-Ceiling, High-Friction Market
- Stagger Entries Around “Stairs”: Use each $10K band as a decision checkpoint—size up only when volume confirms.
- Track ETF Flows Daily: They’re the cleanest proxy for institutional demand. Monitor reversals; use them to fade euphoria or buy dips.
- Watch Retail Signals: Google Trends, exchange sign-ups, and memecoin volumes foreshadow late‑cycle blowoffs.
- Diversify Into Cash-Flowing Crypto Plays: Real yield DeFi, L2 sequencers, RWA protocols—focus on sustainable revenue, not only token price.
- Stay Nimble on Macro: Rate decisions, fiscal policy, and dollar moves can flip correlations.
8. Conclusion: Probability, Not Prophecy
Could Bitcoin hit $200K by December 31, 2025? Yes—but the probability hinges on whether volume, ETF demand, and broader participation re‑accelerate. The bull case is structurally strong: institutions are here, issuance is halved, and power curves still point up. The bear case warns that without fresh liquidity, price climbs become precarious, vulnerable to sharp air drops.
For entrepreneurs and investors, the path is clear: treat BTC as the tide, but fish where the current is strongest—under‑valued alt sectors, infra earning real fees, and regulatory-compliant payment rails. Manage risk in steps, respect liquidity, and you’ll thrive whether BTC stops at $150K or rockets through $200K.
