
Main Points :
- The Bitcoin Fear & Greed Index (FGI) quantifies market sentiment on a 0–100 scale; important components include volatility, momentum/volume, social media, dominance, Google Trends, etc.
- FGI helps investors identify potential entry/exit points by recognizing extremes—“extreme fear” vs “extreme greed” phases.
- It is not predictive on its own; best used in combination with technical, fundamental, and on‐chain analysis.
- Recent market behaviour shows FGI has moved back into the “Fear” zone (score around mid‐40s) as Bitcoin retraces from highs.
- Macroeconomic events, regulatory developments, institutional adoption, and rate policy continue to shape investor sentiment strongly.
- Combining sentiment‐aware models, e.g. using FGI plus technical and alternative data, has shown in recent academic work improved returns though with higher drawdowns.
What Is the Bitcoin Fear & Greed Index?
Definition and Origin
The Bitcoin Fear & Greed Index—sometimes called the “Crypto Fear & Greed Index”—is a tool designed to capture investor emotions in the crypto markets. It expresses market sentiment on a scale from 0 (extreme fear) to 100 (extreme greed). The index has been popularised by sources such as Alternative.me and CoinMarketCap. It integrates several sub‐factors to reflect market mood.
Core Components
Though implementations differ slightly, typical weighted components include:
- Volatility: how wildly Bitcoin’s price is moving relative to recent norms.
- Momentum & Volume: strength of trading activity and price movement.
- Social Media Sentiment: how active and positive discussions are on Twitter (or similar platforms).
- Dominance: the share of Bitcoin relative to altcoins in market capitalization; higher dominance often signals safety‐oriented flows.
- Search Trends: e.g. Google Trends for Bitcoin-related queries.
- Surveys: in some versions, though sometimes paused or less frequently used.
These factors are aggregated (with defined weights per tool) and normalized to the 0-100 scale.
Why It Matters for Investors
Recognizing Over‐ or Under-Valued Sentiment
When sentiment is extremely fearful, prices may be depressed (or risk is overestimated), creating potential buying opportunities. Conversely, in periods of extreme greed, risk of overextension is high, which can signal that selling (or taking profits) may be appropriate.
Supporting Strategy Types
- Contrarian Strategy: Buy when others fear, sell (or reduce exposure) when others are greedy.
- Trend-Following Strategy: Using FGI to confirm momentum breakouts or pullbacks.
- Risk Management: Adjusting position size or reducing leverage when greed is high; avoiding panic during fear phases.
Recent Trends & Market Behavior (2025)
Current Sentiment Shift
As of late September 2025, the Fear & Greed Index has slipped into the “Fear” zone, with values around 43-45. This reflects a decline from more neutral sentiment earlier in the month. The fall in Bitcoin price—from over $117,000–$124,000 highs—plus macroeconomic concerns, has likely driven this shift.
Macro & Regulatory Tailwinds and Headwinds
- Rate Policy: The US Federal Reserve’s rate cuts and expectations thereof have acted as a major tailwind earlier in 2025. However, volatility around announcements and uncertainty have also caused corrections.
- Institutional Adoption & Strategic Reserves: Notable flows into spot BTC ETFs, government strategic reserves (US) and corporate holdings are increasing legitimacy and influencing sentiment.
- Liquidations & Market Corrections: Recent sharp drops have triggered large liquidations (hundreds of millions of dollars in derivatives positions). Such events tend to spike fear and often precede sentiment shifts.
Academic & Quantitative Models
Cutting‐edge research points to portfolio strategies that combine sentiment inputs (including social media, sentiment analysis via language models) with technical indicators (e.g. RSI, moving averages) to achieve significantly higher returns, though with larger drawdowns.
Practical How-To: Using the Fear & Greed Index
Step 1: Monitor the Index Daily / Over Short Intervals
Check current value; note recent trajectory (is the index climbing, falling, or stuck?). Is it at neutral, or has it breached fear/greed thresholds?
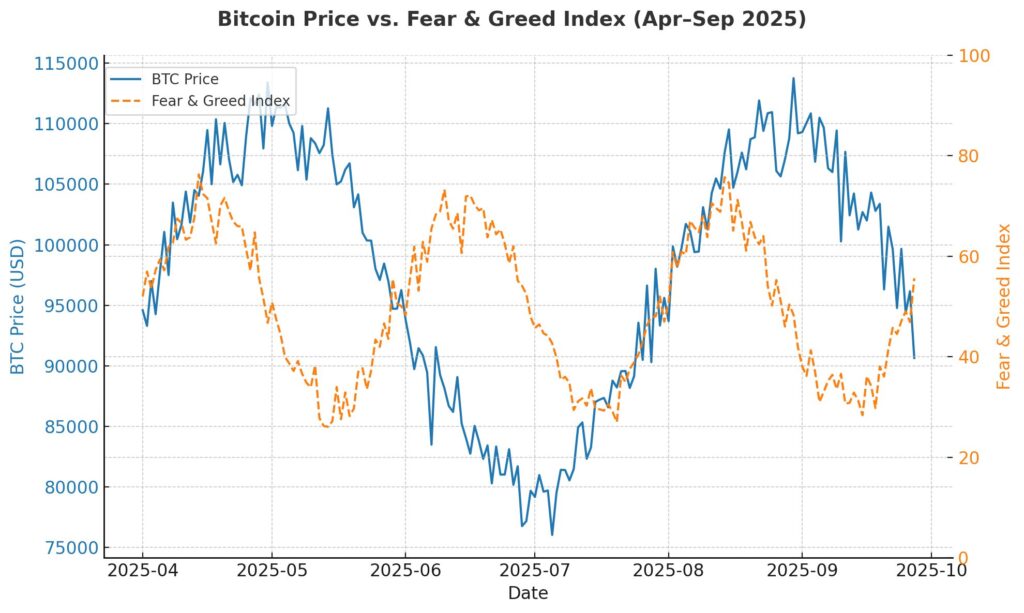
Step 2: Map vs Price Action
Overlay the index with Bitcoin price charts. For example, when price has recently dropped from a high but the FGI falls more steeply, it may suggest fear overshoot (possible bounce). If price is climbing steeply but FGI is diverging (not increasing), that may warn of weak momentum.
Step 3: Combine with Other Indicators
- Technical: RSI, MACD, moving averages for overbought/oversold regions.
- Fundamental / news: regulatory announcements, macroeconomic shifts, rate decisions.
- On‐chain metrics: net flows in/out of exchanges, active addresses, market dominance.
Step 4: Use It for Position Sizing & Entry/Exit
- In “extreme fear” zones (e.g., <25), consider opportunistic entry, but staggered (not all-in at once).
- In “extreme greed” zones (>75), plan partial profit taking, or tighten stop losses.
- Maintain flexibility: if sentiment shifts quickly, be prepared to adjust.
Risks and Common Pitfalls
- Overreliance on Sentiment: Sentiment can stay irrational longer than expected. Fear or greed extremes don’t always immediately reverse price trends.
- Ignoring Volume or Momentum Divergences: If price is rising but volume is weak or momentum indicators are diverging, greed may be fragile.
- External Shocks: Regulation, macro factors, exchange incidents can override sentiment signals.
- Lagging or Noisy Data: Social media sentiment, trend data, or surveys may lag real‐time price changes or be skewed by bots / media hype.
Case Studies
- In August 2025, Bitcoin reached new record highs (≈ $124,000), sentiment heavily leaning toward greed due to expectations of favorable regulations and institutional inflows.
- In mid‐September 2025, despite some macro tailwinds, profit-taking, elevated Treasury yields, and concerns over interest rate policy caused corrections; FGI fell into “Fear” territory as Bitcoin dropped back into the low $110,000s.
What’s New: Emerging Developments
- Growing use of ML/NLP models to extract sentiment from news / social media, showing good predictive power when used alongside technicals.
- Increase in corporate and government reserve accumulation, which acts as a stabilizing factor but may reduce some volatility, affecting the amplitude of fear/greed swings.
- The narrowing difference between traditional financial asset returns (especially bond yields) and crypto risk/return profiles—when yields rise, greed decreases, as risk assets become less attractive.
Summary & Takeaways
In sum, the Bitcoin Fear & Greed Index remains a highly useful tool for investors interested in extracting signal from market emotions. It is particularly good at identifying extremes—when fear is likely overdone, or greed may be pushing valuations into riskier territory. Recent data (as of September 2025) suggests sentiment has shifted back toward fear, correlating with price retracements and broader macroeconomic uncertainty.
For those scouting new crypto assets or next revenue sources, the lesson is: don’t just look at price charts—emotions in the market matter. Combine sentiment tools like FGI with technical, fundamental, and on‐chain metrics. Be nimble, expect volatility, and design your strategy around the idea that sentiment will shift, sometimes sharply.
