Main Points :
- Holders within the 7–10 year holding bracket now control 8.1% of Bitcoin’s supply—the highest since 2019.
- Bitcoin held for over 10 years now accounts for 17% of supply and continues to grow.
- Mid-term holders (5–7 years) are steadily distributing, with their share dropping from 10% to 5% since early 2023.
- Despite whale-led selling (e.g., a major 80,000 BTC transaction via Galaxy), old supply is accumulating faster than being liquidated.
- Net addition of 800,000 BTC per month by long-term holders is observed—a record accumulation rate.
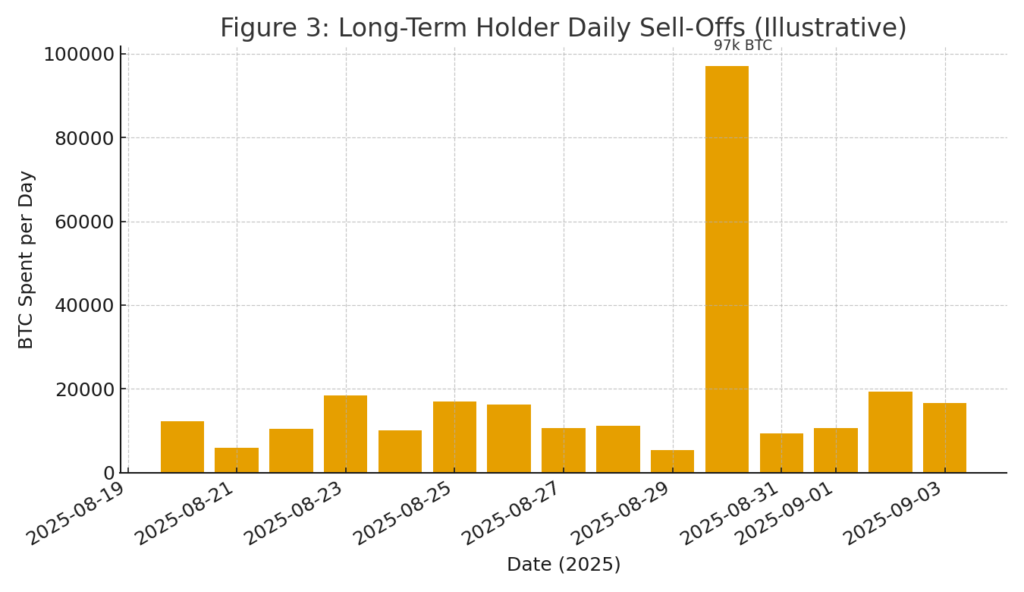
- One-day spike of 97,000 BTC sold by long-term holders marks the largest single-day sell-off of 2025, contributing to short‑term bearish pressure.
- Average holdings per whale (100–10,000 BTC addresses) are now down to 488 BTC, the lowest level since 2018.
- Less than 23% of Bitcoin has moved in the past six months—indicating strong holding sentiment.
1. Long-Term Holders Keep Accumulating (7–10 Year and 10 Year+ Cohorts)
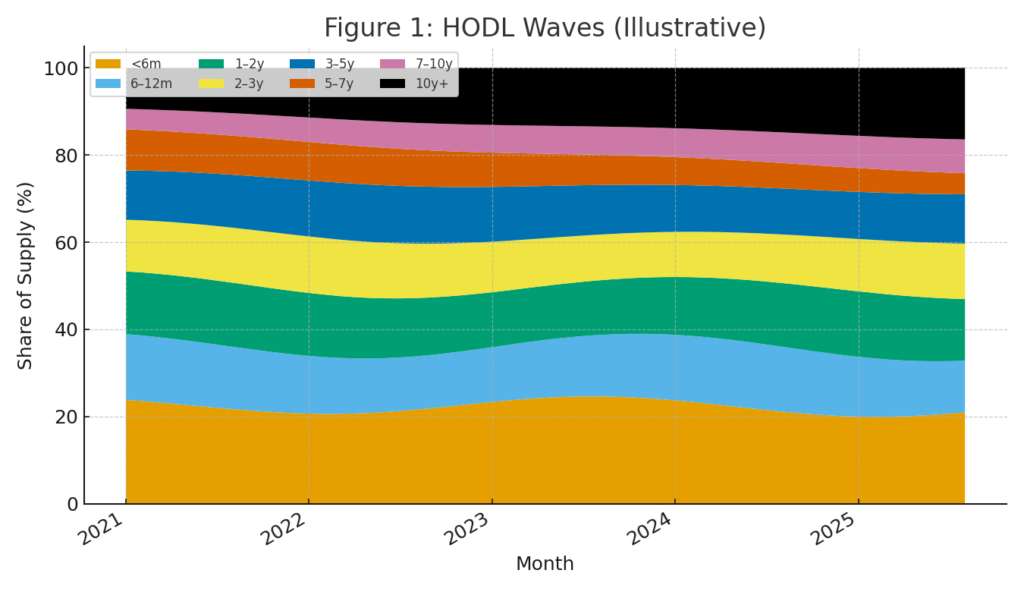
Bitcoin’s oldest hands—those who’ve held BTC for 7–10 years—now control approximately 8.1% of the total supply, the largest share since 2019. Meanwhile, coins held longer than a decade now comprise roughly 17% of circulating supply. This continuous growth underscores that, despite heightened selling narratives, the oldest Bitcoin supply continues to accumulate faster than it’s being offloaded.
Glassnode’s HODL Waves visualization starkly illustrates this phenomenon: the share of coins untouched for many years is expanding, indicating that long‑term holders are steadfastly accumulating rather than capitulating.
2. Mid-Term Holders Are Taking Profits (5–7 Year Cohort)
In contrast, the 5–7‑year cohort has been gradually trimming their holdings—from 10% of total supply in early 2023 down to 5% today. Many of these coins were minted around the $3,000 range during the COVID‑19 crash of 2019–2020. Their steady selling suggests opportunistic profit‑taking along the rally.
3. Whale Activity and One-Day Sell-Offs
Recent narratives have highlighted the impact of whale activity—large holders selling en masse—as a bearish sign for price. Notably, an 80,000 BTC transaction via Galaxy has been publicized. However, Glassnode data suggests this is not the prevailing trend; instead, the oldest holder cohorts are gaining in share.
Still, there was a sharp spike in realized long‑term holder selling: 97,000 BTC sold in a single day—the largest one‑day sell‑off so far in 2025—injecting temporary bearish pressure. Since then, the 14‑day moving average of spending by long‑term holders has exceeded 25,000 BTC, the highest level since January.
4. Record Monthly Accumulation and Holding Sentiment
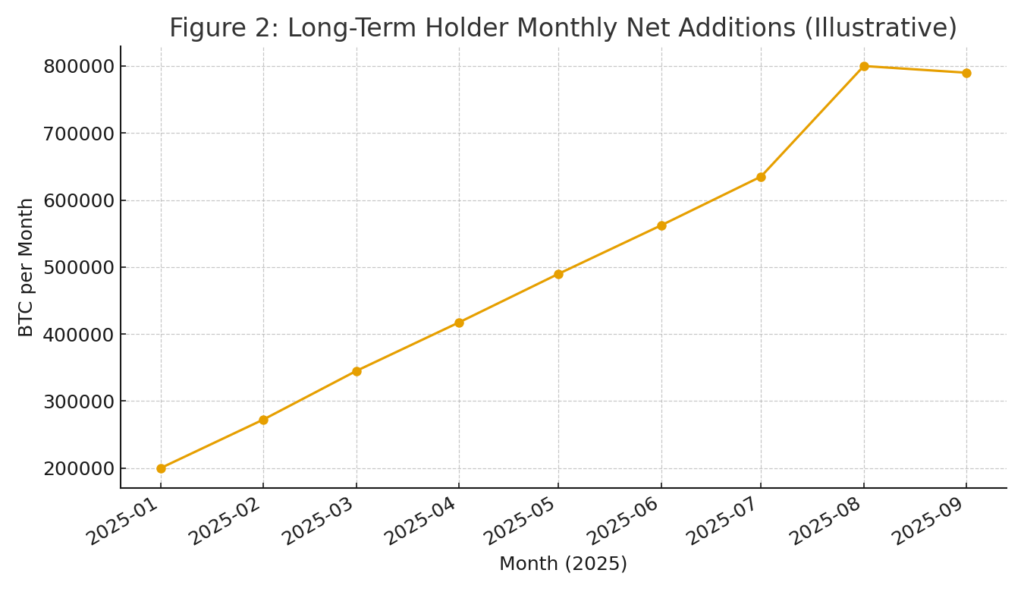
On the accumulation side, CryptoQuant data shows long‑term holders have been adding at an unprecedented pace—800,000 BTC per month, a record in Bitcoin’s history. Only six previous periods came close to that level. Newly added coins in this cohort were often acquired at cost bases between $95,000 and $107,000—tightening that range as potential support.
5. Shrinking Whale Holdings and Potential Market Rebound
Further reinforcing distribution patterns, the average BTC per whale address (holding 100–10,000 BTC) has now dropped to 488 BTC, the lowest since 2018. This indicates that whales are reducing their exposure, potentially signaling short‑term distribution.
Even so, in some market cycles, whale selling precedes renewed rallies—once the supply is absorbed by smaller investors, volatility can give way to further upside.
6. Immobile Supply Suggests Supply Squeeze
Data from Bitcoin Magazine Pro’s HODL Waves indicates that less than 23% of all BTC has moved in the last six months, hinting that over 77% is being tightly held. Historically, such immobile supply has preceded explosive price moves, as new demand meets limited circulating inventories.
7. A Nuanced Picture Emerges
Taken together, the picture is not of wholesale distribution by old holders, but of selective profit-taking amid steadfast accumulation from the oldest cohorts. Long‑term holders are collectively increasing their grip, even as mid‑term holders cash in and whales rotate out. The result is a nuanced market structure, deepening conviction from true “HODLers,” potential short‑term pressure, and underlying signals for future strength.Place for Graph / Figure (Image Insert)
Please insert here: [Figure: Glassnode HODL Waves chart showing distribution across holding age bands; Cointelegraph/Glassnode chart showing 800k BTC monthly long‑term additions; CoinDesk data on 97k BTC one‑day sell‑off]
