Main Points :
- Silver has entered full price discovery mode, reaching an all-time high above $66.50.
- Gold is trading just 1–1.5% below its historical peak around $4,380, signaling a decisive moment.
- Technical indicators suggest both metals are in late-stage impulse waves, not early-cycle breakouts.
- Silver’s breakout above a 40+ year resistance level represents a historic structural shift.
- This precious metals surge has deep implications for crypto investors, alternative assets, and monetary hedging strategies.
Introduction: A Defining Moment for Hard Assets
Silver and gold are once again commanding global attention. On Wednesday, silver surged to a historic high of $66.85, extending a parabolic rally that has been building for months. At the same time, gold is trading quietly just below its own all-time high near $4,380, creating a moment of tension across the metals market.
This is not merely another speculative spike. What we are witnessing may represent a structural inflection point in the global perception of hard assets—one that resonates strongly with investors searching for alternative stores of value, including those active in digital assets and blockchain-based finance.
The critical question now facing markets is simple but profound:
Is this the final blow-off top before a correction, or the opening chapter of a broader, sustained revaluation of precious metals?
Silver’s Historic Breakout: Entering Price Discovery
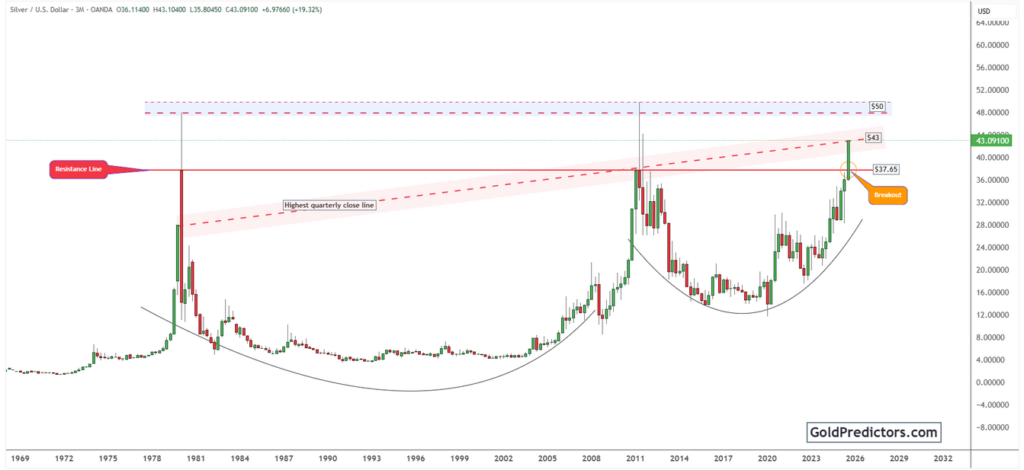
Silver’s rally in 2026 has been nothing short of extraordinary. After spending decades capped beneath long-term resistance, the metal decisively broke above the $38 horizontal resistance zone—a level that had constrained price action since 1980.
Once that barrier fell, silver did not hesitate. Prices accelerated vertically, confirming what technical traders describe as a classic long-term breakout from generational resistance.
Such breakouts are rare. When they occur, they often result in outsized moves because there is no historical overhead supply—no previous sellers waiting to exit at breakeven.
“Silver 3-Month Parabolic Breakout Chart”
(Search query: silver price breakout chart 2026 parabolic move technical analysis)
Momentum Confirms the Silver Surge
Technical indicators are reinforcing the strength of silver’s move:
- Relative Strength Index (RSI) is firmly above 70, indicating strong momentum.
- MACD remains decisively positive, signaling trend continuation.
- Volume expansion confirms institutional participation rather than retail-only speculation.
However, momentum cuts both ways. These readings also suggest that silver is approaching its first major technical decision zone.
The $72–$73 Zone: Where Gravity May Return
The next critical level lies near the 1.61 Fibonacci extension, around $72.90. Historically, such zones often attract profit-taking and trigger local reversals—especially after steep parabolic advances.
From a short-term perspective, silver appears to be in the fifth and final wave of an Elliott Wave impulse that began in October. Fifth waves are often powerful—but fragile.
“Silver Elliott Wave Count and Fibonacci Extensions”
(Search query: silver elliott wave count fibonacci extension chart)
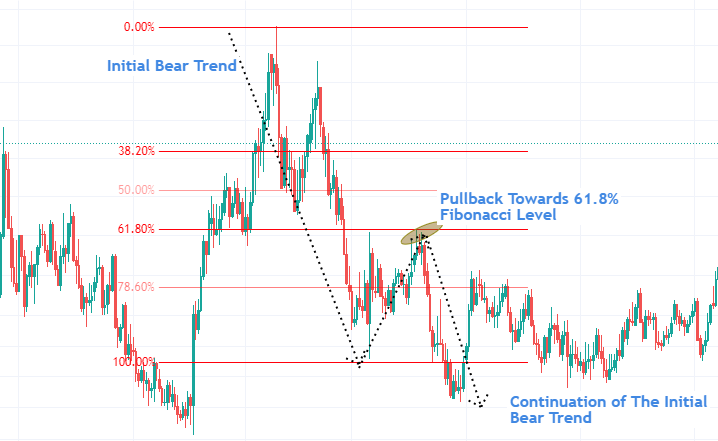
Current projections suggest a likely topping range between $69 and $73, derived from overlapping 2.61 Fibonacci extensions across multiple wave degrees.
This does not invalidate the long-term bullish case—but it strongly argues for caution in the near term.
Gold’s Quiet Strength: A Different Kind of Setup
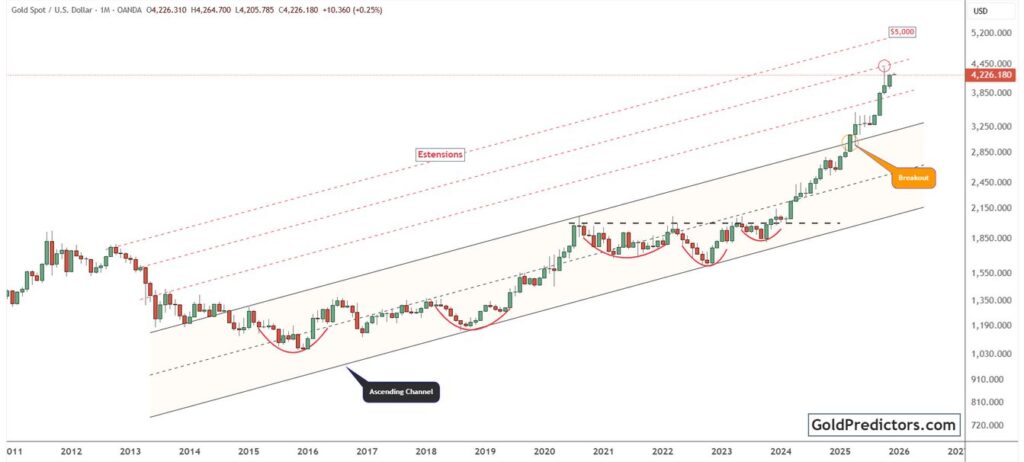
Gold’s price action mirrors silver’s in structure but differs in character. Gold is also believed to be in its fifth and final impulse wave, which began on October 24. Unlike silver’s vertical explosion, gold’s advance has remained orderly, contained within a parallel rising channel.
Today, gold is attempting to close above the $4,350 horizontal resistance level—a key threshold separating consolidation from price discovery.
The first attempt failed. The next will determine whether gold joins silver in rewriting history.
“Gold Price Near All-Time High Resistance Zone”
(Search query: gold price resistance 4350 breakout chart technical analysis)
Will Gold Break $4,400? Probably—but Not Explosively
If gold successfully clears $4,350, a marginal new all-time high above $4,400 is plausible. However, the geological structure of the trend suggests limited upside acceleration.
In contrast to silver’s violent repricing, gold’s move appears more like a late-cycle confirmation than the beginning of a new secular leg.
This distinction matters.
What This Means for the Broader Precious Metals Cycle
Silver leading gold is historically significant. It often signals heightened speculative appetite and late-cycle enthusiasm rather than early-stage accumulation.
Current signals indicate:
- This is not the early expansion phase of an economic cycle.
- It is more likely a late-stage momentum phase, driven by:
- Monetary debasement fears
- Geopolitical fragmentation
- Loss of confidence in fiat-only systems
Whether this phase ends in a sharp correction or a prolonged consolidation will define precious metals performance in the coming quarters.
Implications for Crypto and Alternative Asset Investors
For investors focused on crypto, this metals rally offers important context rather than competition.
Historically:
- Gold often acts as the institutional gateway hedge
- Silver behaves like a high-beta monetary asset
- Bitcoin and digital assets follow once confidence in alternative value systems broadens
Silver’s explosive move may therefore be read as a risk-on signal for non-sovereign assets, rather than a threat to crypto.
In other words, this may be a prelude—not a substitution.
Conclusion: Silver Leads, Gold Confirms, and the Clock Is Ticking
Silver’s break into price discovery confirms a historic breakout decades in the making. Gold stands just behind, poised for confirmation but unlikely to replicate silver’s velocity.
Technically, both metals appear closer to local peaks than fresh beginnings. Strategically, however, their performance reflects a deeper shift in how markets perceive value, trust, and monetary resilience.
One thing is clear:
Silver is leading—and gold is following.
What happens next will shape not only the precious metals market, but the broader landscape of alternative assets, including crypto, for years to come.
