Main Points :
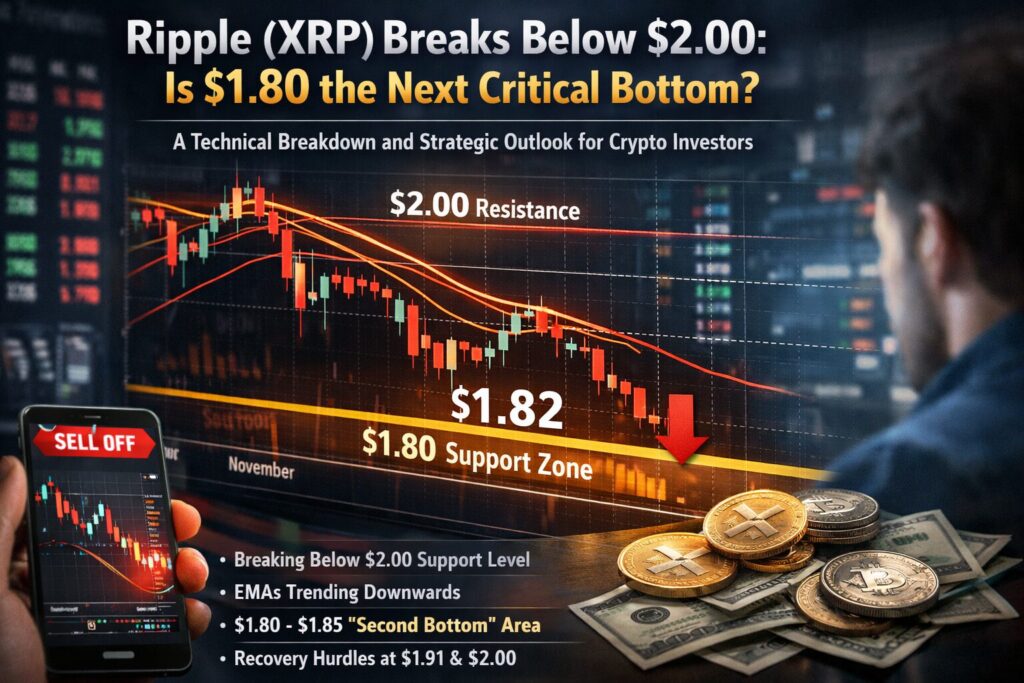
- XRP has decisively broken below the psychologically and technically critical $2.00 support level, accelerating bearish momentum.
- Short-term and mid-term exponential moving averages (EMAs) are sharply declining, confirming strong selling pressure.
- Market focus is shifting to the $1.80–$1.85 zone, which represents a potential “second bottom” formed in late November.
- A meaningful recovery would first require reclaiming the short-term EMA near $1.91, followed by overcoming heavy resistance between $1.95 and $2.00.
- XRP’s current price action reflects broader crypto market risk-off sentiment, but also creates potential opportunity zones for strategic accumulation and derivatives-based trading.
1. XRP’s $2.00 Breakdown: Why This Level Mattere
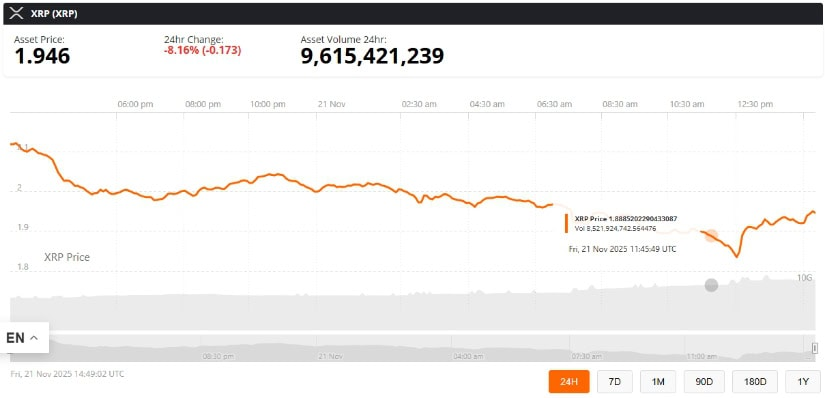
For weeks, Ripple (XRP) had been defending the $2.00 level with remarkable persistence. This price zone was not only a round psychological number, but also a well-defined technical support level respected across multiple timeframes. The eventual breakdown below $2.00 has therefore carried disproportionate technical and psychological significance.
Once this support failed, selling pressure intensified rapidly. Stop-loss orders clustered below $2.00 were triggered almost simultaneously, producing a cascading effect often described as “sell-the-break” behavior. As a result, XRP entered a sharp downward leg, shifting market structure from consolidation to clear short-term downtrend.
From a broader perspective, such breakdowns tend to mark regime changes. Instead of range-bound trading, price action becomes directional, volatility expands, and short-term sentiment shifts decisively bearish.
2. Technical Structure on the 4-Hour Chart
(“XRP/USD 4-Hour Chart with 7-EMA and 28-EMA”)
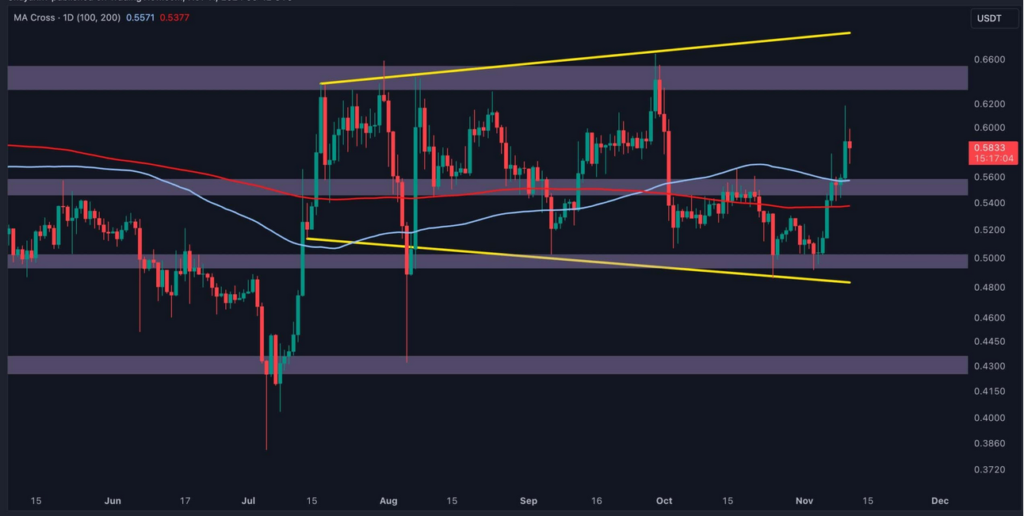
On the 4-hour timeframe, the technical damage is clearly visible. The previously respected support line has been broken, and price is now trading decisively below both key moving averages.
The 7-period exponential moving average (EMA), often used to track short-term momentum, is sloping steeply downward. The 28-period EMA, representing a broader short-to-mid-term trend, is also pointing down. Importantly, the distance between these two EMAs is widening.
This expanding divergence between short-term and mid-term EMAs is a textbook bearish signal. It indicates that selling pressure is not only persistent but accelerating, with little evidence of mean reversion.
At the time of analysis, XRP price is trading well below the falling 7-EMA (approximately $1.91). When price cannot even retrace to a short-term moving average, it often reflects panic-driven market psychology and forced liquidation rather than orderly profit-taking.
3. Market Psychology: From Defense to Capitulation
The failure of $2.00 transformed trader psychology almost instantly. What was previously perceived as a “safe dip-buying zone” has now become a reference point for regret and resistance.
Traders who accumulated near $2.00 are now underwater. Any rebound toward that level is therefore likely to meet supply from participants seeking to exit at breakeven. This phenomenon, often referred to as “role reversal,” is why former support zones frequently become strong resistance.
At the same time, momentum-oriented traders and algorithmic strategies tend to increase short exposure once such key levels are lost. This creates a self-reinforcing cycle in which rallies are sold and volatility remains elevated.
4. The Critical Zone Ahead: $1.80–$1.85 as a Potential Second Bottom
(“XRP/USD Support Zone Highlighting $1.80–$1.85”)
With $2.00 broken, market attention has shifted decisively lower. The next major area of interest lies between $1.80 and $1.85, corresponding to the sharp sell-off lows formed in late November.
This zone represents a potential “second bottom.” From a technical analysis standpoint, a successful defense here could form a double-bottom-like structure, often associated with trend stabilization or at least a tradable bounce.
However, failure to hold this zone would significantly worsen the technical outlook. Below $1.80, XRP would enter a price region with limited historical support, increasing the risk of accelerated downside and disorderly liquidation.
5. Bullish Scenario: What Would a Recovery Require?
While the prevailing trend is bearish, it is essential for traders and investors to define invalidation points for that thesis.
The first step toward stabilization would be a reclaim of the 7-period EMA near $1.91. Such a move would signal that short-term selling pressure is easing. However, this alone would not constitute a trend reversal.
Above that, the $1.95–$2.00 zone now acts as a dense resistance cluster. It includes the former support level, trendline resistance, and the downward-sloping mid-term EMA. A decisive breakout above this zone would be required to shift market structure back toward neutrality.
Given the current technical configuration, a sharp V-shaped recovery appears unlikely. Any upside is more plausibly characterized as corrective rather than impulsive, at least in the near term.
6. Broader Context: XRP Within the Current Crypto Market Cycle
XRP’s weakness does not exist in isolation. Across the broader crypto market, risk appetite has been fluctuating amid macroeconomic uncertainty, regulatory headlines, and year-end positioning by institutional participants.
In recent weeks, Bitcoin and major altcoins have experienced increased volatility, with capital rotating rapidly between sectors. For assets like XRP, which are often used as liquidity instruments rather than pure store-of-value plays, such conditions can amplify price swings.
From a practical blockchain-use perspective, this environment reinforces the importance of separating long-term fundamental narratives from short-term market structure. Even assets with strong use cases and institutional partnerships can experience deep technical drawdowns during risk-off phases.
7. Strategic Implications for Investors and Traders
For readers seeking new crypto assets, revenue opportunities, or practical blockchain exposure, XRP’s current setup offers several distinct strategic considerations:
- Spot Investors: The $1.80–$1.85 zone may represent a high-risk, high-information area. Accumulation here requires strict risk management and a clear invalidation level.
- Derivative Traders: Elevated volatility and clear resistance zones favor range-based strategies and short-term momentum trades rather than directional conviction.
- Builders and Operators: Market drawdowns often reduce speculative noise, allowing greater focus on actual payment rails, on-chain liquidity flows, and enterprise adoption metrics.
8. Conclusion: A Make-or-Break Moment for XRP
Ripple (XRP) has entered a technically dangerous zone after decisively breaking below $2.00. The loss of this long-defended level has accelerated bearish momentum and shifted attention toward the $1.80 region as the next critical battleground.
Holding this zone is essential for avoiding a deeper structural breakdown into year-end trading. Failure, on the other hand, would open the door to further downside and prolonged weakness.
For now, caution dominates. XRP must first prove it can stabilize before any sustainable recovery narrative can take hold. In volatile markets like crypto, survival of key levels often matters more than optimistic forecasts.
