Main Points:
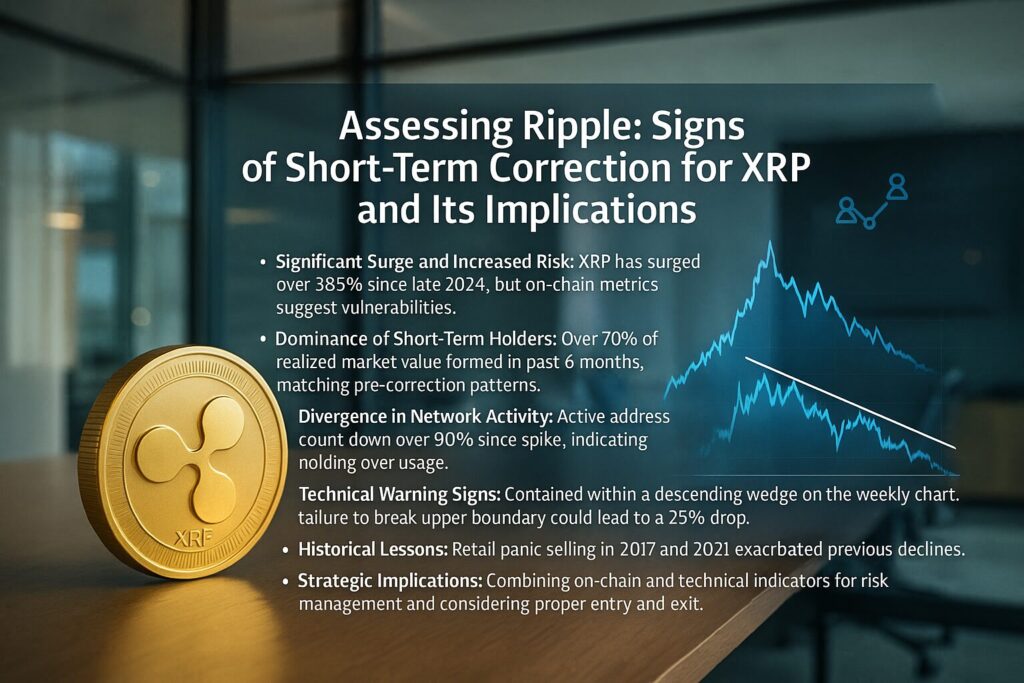
- Substantial Rally, Rising Risks: XRP has surged over 385% since late 2024, driven by new investor inflows, but on-chain metrics warn of vulnerability.
- Short-Term Holder Dominance: More than 70% of realized cap formed in the past six months, echoing patterns preceding major drawdowns.
- Network Activity Divergence: Active addresses spiked then collapsed by over 90%, signaling holding rather than usage.
- Technical Warning Signs: Weekly charts show XRP stuck in a falling wedge; failure to break the upper trendline suggests a potential 25% drop to ~$1.76.
- Broader Crypto Context: Comparisons to 2017 and 2021 sell-offs highlight how retail panic can exacerbate declines.
- Strategic Takeaways: Investors should monitor on-chain and technical indicators to manage risk and identify potential entry points.
1. Introduction
Since late 2024, XRP has captured headlines with a staggering rally of over 385%, fueled by renewed optimism around Ripple’s legal clarity and broader crypto market momentum. Yet beneath the surface excitement, fresh on-chain intelligence and chart patterns suggest that XRP may be poised for a meaningful short-term correction. This article delves into the on-chain data, network usage metrics, and technical analysis underpinning these concerns, situates them within historical precedents, and offers guidance for investors seeking to navigate potential turbulence.
2. On-Chain Analysis: Realized Cap and Holder Composition
On-chain analytics firm Glassnode defines realized market capitalization as the cumulative value of each token at its last movement price. Notably, over 70% of XRP’s realized cap has been accumulated by coins that last moved between late 2024 and early 2025—many of which belong to “3–6 month” short-term holders. This mirrors the build-up seen just prior to the 2017 peak near $3.55, which preceded an approximate 95% collapse, and the early 2021 rally preceding an 80% drawdown. Such clustering of recent investor cost bases near all-time highs tends to create acute selling pressure during pullbacks, as new entrants hastily realize gains or cut losses.
Specifically, data shows a pronounced uptick in realized cap among coins aged 3–6 months starting November 2024, with a peak around the January 2025 high near $3.40. This concentration of cost basis near the top implies that a downward retracement could trigger a cascade of stop-loss and profit-taking transactions, amplifying price decline beyond typical market corrections.
3. Network Activity: From Breakout to Breakdown
A healthy blockchain ecosystem exhibits rising on-chain usage—measured by metrics such as active addresses—alongside price appreciation. However, for XRP, the opposite trend has unfolded. Active addresses exploded to record levels in March 2025, coinciding with the price breakout, but then plummeted by over 90%, returning to pre-breakout norms. This divergence—price up, usage down—frequently signals “hold-only” sentiment rather than genuine adoption, reminiscent of lapses seen before the 2017 and 2021 tops. While no single indicator guarantees a reversal, such divergence historically marks local tops across cryptocurrencies.
The steep decline in network activity suggests that XRP’s recent rally has been predominantly speculative, with fewer participants transacting or leveraging the token for payments. Should usage metrics fail to recover, price support may weaken, laying the groundwork for a corrective phase once broader market sentiment sours.
4. Technical Analysis: The Falling Wedge Conundrum
Turning to technical chart patterns, XRP’s weekly price action forms a classic falling wedge: converging trendlines sloping downward. Normally, a falling wedge resolves bullishly if prices break to the upside; however, XRP has repeatedly failed to breach the upper wedge trendline as of May 26, 2025. Instead, price remains contained, marking the third consecutive rejection at resistance. Failure to overcome this ceiling suggests the pattern could invert into a bearish breakdown, targeting the wedge’s lower boundary—approximately 25% below current levels, near $1.76, which aligns with the 50-week exponential moving average (EMA).
Should XRP slide toward the lower wedge line, this could exact a near-term correction in line with many altcoin bearish patterns. A move down to ~$1.76–$1.80 would represent not only technical vindication of the wedge but also re-testing of key longer-term support. Failure of that zone might open the door to even deeper retracements. Traders monitoring stop levels just below the 50-week EMA could inadvertently accelerate declines through cascade selling.
5. Historical Parallels: Lessons from 2017 and 2021
The 2017 XRP parabolic ascent to roughly $3.55 unfolded amid similar narratives of retail FOMO and on-chain indicators flashing over-extension. Active addresses peaked, then waned sharply, and once the market retraced, XRP surrendered nearly 95% of its value. A comparable sequence played out in 2021: on-chain valued cap for short-term holders jumped, only to precede an 80% downturn. These historical drawdowns illustrate how fragile retail-driven rallies can be, particularly when investors’ cost basis congregates at cycle highs.
While crypto markets constantly evolve—with improved custody solutions, institutional frameworks, and regulatory clarity—human psychology remains cyclical. Overconfidence at peaks, panic at troughs. Current on-chain and chart patterns thus warrant respect, even as macro tailwinds or novel use cases could temper outright capitulation. Investors should view these precedents not as destiny but as cautionary benchmarks.
6. Broader Market Factors and Recent Developments
Beyond pure on-chain and technical readings, several external factors could shape XRP’s near-term path:
- Regulatory Milestones: Ripple’s ongoing global expansion efforts, such as recent partnerships in the Middle East and Asia, lend fundamental support. However, any unexpected regulatory setbacks—particularly in the U.S. following the SEC litigation—could trigger volatility.
- Macro Crypto Trends: With Bitcoin and major altcoins pulling back in May 2025 amid profit-taking after record ETF inflows earlier in the year, XRP is subject to broader risk-off sentiment. A sustained crypto market correction could coincide with the wedge breakdown scenario.
- Institutional Interest: Surveys indicate a rise in wallets holding 10,000+ XRP, suggesting growing institutional appetite. Yet, large holders can both stabilize via strategic accumulation and instigate sharp moves by rotating portfolios. Monitoring whale transactions on exchanges is crucial to anticipate supply shifts.
- Product Innovations: Ripple’s expansion of on-chain settlement corridors in Africa and Latin America, and exploration of CBDC integration, may underpin long-term adoption. Nevertheless, these fundamental drivers often operate on multi-quarter timelines, offering limited near-term relief if technical pressures dominate.
7. Strategic Takeaways for Investors
Given the convergence of bearish on-chain signals, technical pattern risk, and historical precedents, investors should consider the following tactics:
- Position Sizing & Stops: Scale into long positions only on clear signs of wedge support holding (e.g., rebounds near $1.76–$1.80) and employ stop-losses just below to limit downside in a breakdown scenario.
- Monitor On-Chain Activity: Watch weekly active addresses. A renewed uptick above pre-breakout levels could signal genuine adoption returning, potentially invalidating the bearish case.
- Diversify with Macro Exposure: Hedge crypto risk with allocations to Bitcoin or stablecoins during potential altcoin downturns; historically, BTC has shown more resilience during altcoin corrections.
- Follow Regulatory News: Any major legal or policy developments involving Ripple Labs or XRP listings can catalyze price swings; staying informed enables timely adjustments.
- Stagger Entry Points: Consider dollar-cost averaging through expected volatility, rather than lump-sum purchases at current highs, to mitigate entry timing risk.
8. Conclusion
XRP’s impressive rally since late 2024 underscores both renewed confidence in Ripple’s vision and the enduring allure of crypto speculation. However, on-chain metrics reveal a concentrated buildup of short-term holder cost bases and a pronounced divergence between price and network usage—hallmarks of topping patterns seen in 2017 and 2021. Overlaying these with a vulnerable falling wedge on the weekly chart highlights the genuine possibility of a 25% short-term correction toward the $1.76 region.
While the broader crypto market and Ripple’s strategic initiatives may ultimately support XRP’s medium- to long-term outlook, prudent risk management around potential technical breakdowns and historical precedents is paramount. Investors seeking exposure should align position sizing, stop-loss strategies, and staggered entries with clear on-chain and chart confirmations, ensuring readiness to navigate whatever volatility lies ahead.
