Main Points :
- Bitcoin has fallen more than 35% from its recent all-time high of approximately $126,200, raising the question of whether the market is approaching a local bottom.
- Technical indicators, including weekly Stochastic RSI and multi-day bullish divergence, are flashing signals historically associated with major market reversals.
- On-chain data, particularly a recent decline in hash rate, suggests miner capitulation—often a contrarian bullish signal.
- Macro liquidity indicators, such as the U.S. Financial Conditions Index (NFCI), imply that a rebound could materialize within 4–6 weeks.
- For investors seeking new crypto assets, yield opportunities, or practical blockchain use cases, the current environment may represent a strategic accumulation phase rather than a temporary bounce.
1. Market Context: A Deep Pullback After Historic Highs
Bitcoin (BTC) has experienced a sharp correction following its peak near $126,200, declining by over 35% within roughly two months. Such pullbacks are not unusual in Bitcoin’s history, even during long-term bull markets. What distinguishes the current phase is the convergence of technical, on-chain, and macroeconomic signals, many of which have historically aligned near major cycle lows.
Rather than focusing on short-term price volatility, professional investors increasingly analyze momentum shifts, miner behavior, and global liquidity conditions to assess whether downside risk is diminishing. The latest data suggests that selling pressure may be nearing exhaustion.
2. Technical Indicators: Momentum Turning Before Price
2.1 Weekly Stochastic RSI Signals Oversold Reversal
In December, Bitcoin’s weekly Stochastic RSI rebounded from deeply oversold territory. According to chart analyses shared by trader Jelle, this setup has repeatedly appeared near pivotal market bottoms.
Historically similar signals occurred:
- Early 2019: After BTC bottomed near $3,200, preceding a multi-month recovery.
- March 2020: Around $3,800, following the COVID-19 liquidity shock.
- Late 2022: Near $15,500, marking the post-FTX cycle low.
In each case, momentum shifted first, while price followed with a lag—an important reminder that markets often turn before sentiment improves.
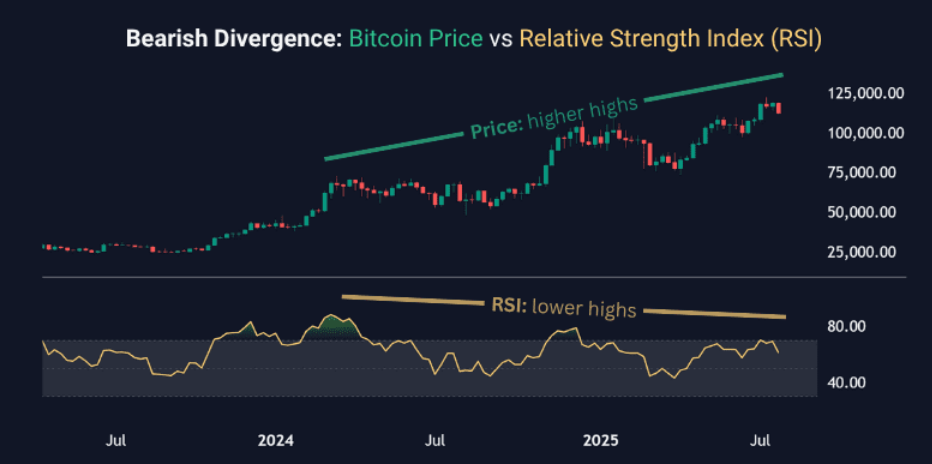
2.2 Bullish Divergence on the 3-Day Chart
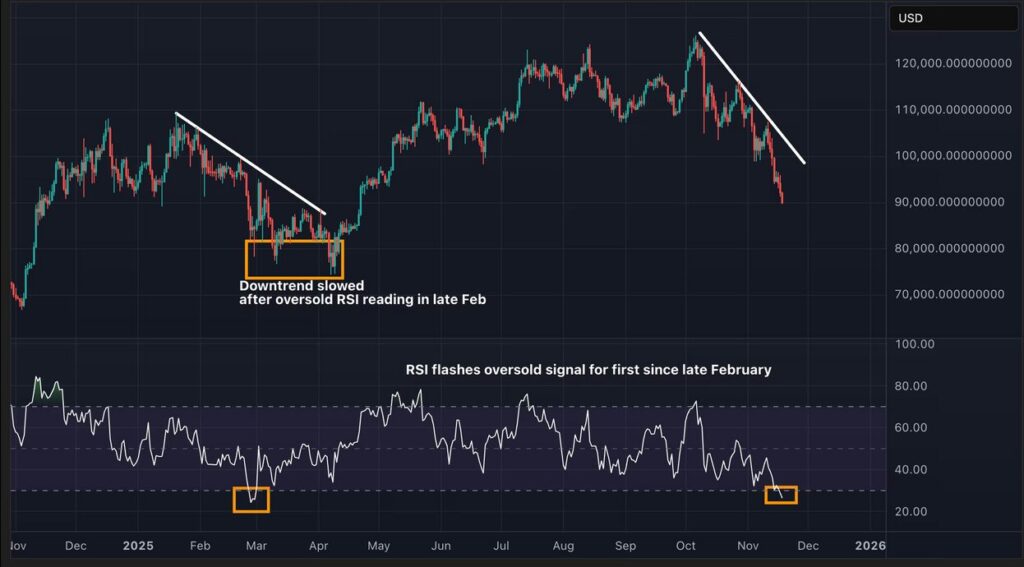
On the 3-day BTC/USD chart, price has continued to make lower lows, while momentum indicators have failed to do so—forming a bullish divergence. This pattern suggests weakening selling pressure.
Comparable divergences were observed:
- During the mid-2021 correction, before Bitcoin resumed its uptrend.
- In late 2022, shortly before the prolonged recovery following the FTX collapse.
Such divergences typically accompany structural bottoms, not merely short-lived relief rallies.
3. On-Chain Perspective: Miner Capitulation as a Contrarian Signal
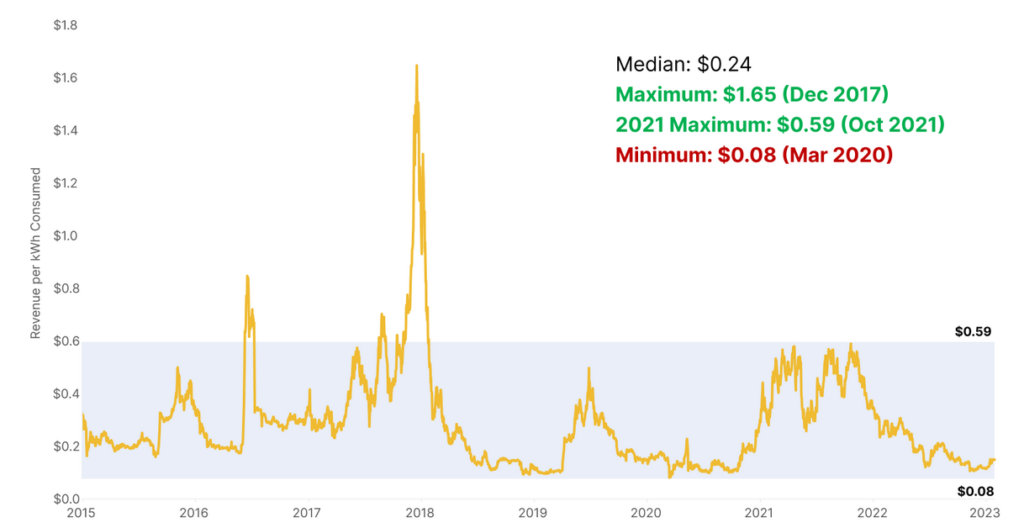
3.1 Hash Rate Decline Reflects Miner Stress
In the one-month period leading up to December 15, Bitcoin’s network hash rate declined by approximately 4%. Analysts Matt Sigel and Patrick Bush of VanEck interpret this as a sign of miner capitulation.
Miner exits often occur when profitability compresses due to lower prices, rising costs, or both. While this appears negative on the surface, it has historically functioned as a contrarian bullish indicator.
3.2 Historical Performance After Hash Rate Declines
Since 2014, data shows that after a 30-day sustained hash rate decline:
- Bitcoin posted positive returns within 90 days in ~65% of cases.
- Over 180 days, the probability of gains rose to 77%, with an average increase of ~72%.
As prices recover, miner profitability improves, often leading to the reactivation of idle mining equipment, reinforcing network strength and price momentum.
4. Macro Liquidity Signals: The 4–6 Week Window
4.1 Financial Conditions Index as a Leading Indicator
Beyond crypto-native metrics, macro liquidity plays a critical role in Bitcoin price dynamics. Analyst Mihaël van de Poppe and macro researcher Miad Kasravi highlight the relevance of the U.S. Financial Conditions Index (NFCI).
Backtesting across 105 indicators suggests that peaks in NFCI often precede Bitcoin price rebounds by 4–6 weeks.
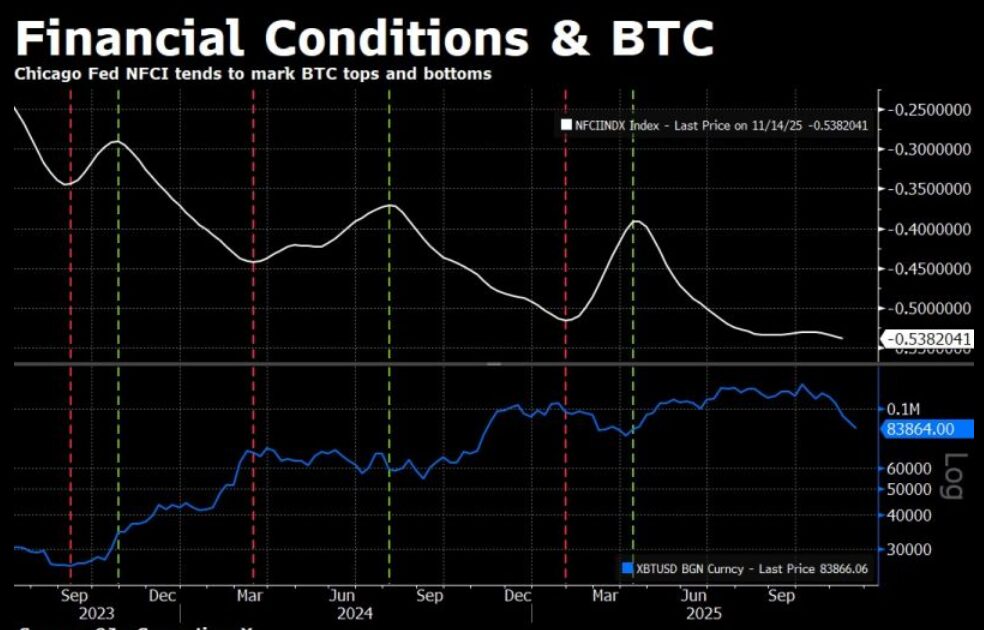
This relationship appeared:
- In late 2022, before BTC’s recovery from cycle lows.
- In mid-2024, ahead of a sharp upward move.
Historically, each 0.10-point decline in NFCI has correlated with a 15–20% increase in Bitcoin price.
As of December, NFCI stands at approximately -0.52, continuing its downward (loosening) trend.
4.2 Federal Reserve Balance Sheet Dynamics
A potential catalyst lies in the U.S. Federal Reserve’s consideration of swapping mortgage-backed securities for short-term Treasury bills. While not formal quantitative easing (QE), Kasravi describes this as a “non-QE liquidity injection”, similar to conditions in 2019 that preceded a ~40% Bitcoin rally.
Such subtle liquidity shifts often benefit scarce, globally liquid assets like Bitcoin.
5. What This Means for Investors and Builders
For market participants seeking new crypto assets, yield strategies, or practical blockchain applications, the current environment offers several implications:
- Risk-Reward Skew: With selling pressure waning, downside risk may be increasingly limited relative to upside potential.
- Accumulation Phase: Historically, periods of miner stress and negative sentiment have favored disciplined accumulation.
- Infrastructure Opportunities: Miner capitulation often accelerates efficiency improvements and innovation within the Bitcoin ecosystem.
- Broader Crypto Impact: A Bitcoin rebound frequently restores liquidity and confidence across altcoins, DeFi, and Web3 infrastructure projects.
6. Conclusion: A Confluence Rarely Seen in Isolation
While no single indicator guarantees a market bottom, the alignment of technical momentum reversals, on-chain miner capitulation, and improving macro liquidity is difficult to ignore. Historically, such convergence has marked meaningful inflection points rather than fleeting bounces.
Bitcoin may still experience volatility in the short term. However, the evidence increasingly supports the view that the market is transitioning from distribution to accumulation.
For long-term participants—whether investors, miners, or builders—this phase may prove less about timing the exact bottom and more about positioning ahead of the next structural expansion.
