
Key Takeaways :
- At the beginning of 2026, Bitcoin remains in a high-volatility range without a clear long-term directional bias.
- The most probable outlook is a continuation of a “twisted range scenario,” driven by macroeconomic uncertainty and policy misalignment.
- Rather than price targets, investors should prioritize structural on-chain indicators such as Exchange Netflow, Coinbase Premium, and SOPR.
1. Where Is the Bitcoin Market at the Start of 2026?
As 2026 begins, it is difficult to argue that Bitcoin has entered a new, sustainable bull market. The current environment is best described as a high-volatility range, where neither bullish nor bearish narratives have fully taken control. Prices fluctuate aggressively, yet fail to establish a consistent trend.
There are undeniably strong medium- to long-term tailwinds. Spot Bitcoin ETFs have lowered the barrier for institutional capital, while the post-halving supply structure continues to limit new issuance. Over time, these factors should provide structural support to the market.
However, several counterweights remain. The global macroeconomic environment is unstable, with slowing growth indicators in major economies. In the United States, political constraints tied to the election cycle reduce the flexibility of fiscal and monetary policy. Meanwhile, derivatives markets continue to dominate short-term price action, amplifying volatility and encouraging speculative positioning rather than long-term accumulation.
Taken together, the most reasonable stance at present is neutral to slightly bearish on a conditional basis. This does not imply an inevitable decline. Rather, it reflects the absence of convincing structural data that would justify strong confidence in sustained upside. In such an environment, defining the market correctly is more important than predicting its next move.
2. Three Structural Scenarios for Bitcoin in 2026
The following scenarios are not price forecasts in the traditional sense. Instead, they are structural frameworks that help interpret how capital flows, macro conditions, and participant behavior could interact throughout 2026.
Scenario A: Twisted Range (High Probability)
In this base scenario, expectations of monetary easing persist, but real economic recovery remains weak. As a result, a mismatch emerges between financial policy and underlying economic conditions. Liquidity enters the market intermittently, yet struggles to settle as long-term capital.
ETF inflows exist, but are dominated by short-term positioning rather than strategic allocation. Capital rotates frequently, and conviction remains fragile.
Under these conditions, Bitcoin is likely to trade within a wide range between $80,000 and $140,000, with the most active trading zone concentrated around $90,000 to $120,000. The lower $80,000 area functions as a psychological and structural support during corrections, while the $130,000–$140,000 zone caps upside when narratives temporarily turn optimistic.
This scenario reflects a market that is alive, liquid, and volatile—but ultimately indecisive.
Scenario B: Macro Shock (Medium Probability)
In this scenario, economic deterioration becomes unmistakable. Credit stress, rising defaults, or systemic financial anxiety trigger broad risk-off behavior across asset classes. Investors are forced to reduce exposure, and liquidity tightens rapidly.
If ETF flows turn decisively negative and leveraged positions unwind simultaneously, Bitcoin could break below the $80,000 level. In more severe cases, a drawdown into the $50,000 range cannot be ruled out.
While such levels may appear extreme, they would likely coincide with strong long-term demand zones. Historically, periods of forced deleveraging have often created opportunities for structural accumulation, even if sentiment is deeply negative at the time.
Scenario C: Risk-On Revival (Low Probability)
The most optimistic scenario assumes that expectations of monetary easing lead actual economic deterioration. If liquidity expansion arrives early and ETF inflows become persistent rather than speculative, risk appetite could return decisively.
In this case, Bitcoin could advance into the $120,000 to $170,000 range, with extreme conditions briefly pushing attention toward the $200,000 level.
However, this outcome requires multiple favorable factors to align simultaneously: supportive macro data, stable policy signals, and sustained institutional demand. As such, it remains a low-probability but high-impact scenario.
3. On-Chain Indicators to Watch in the Range Scenario
If Scenario A remains dominant, price alone provides limited insight. Instead, investors should monitor on-chain indicators that reflect real supply-demand dynamics and participant behavior. Three metrics are particularly valuable.
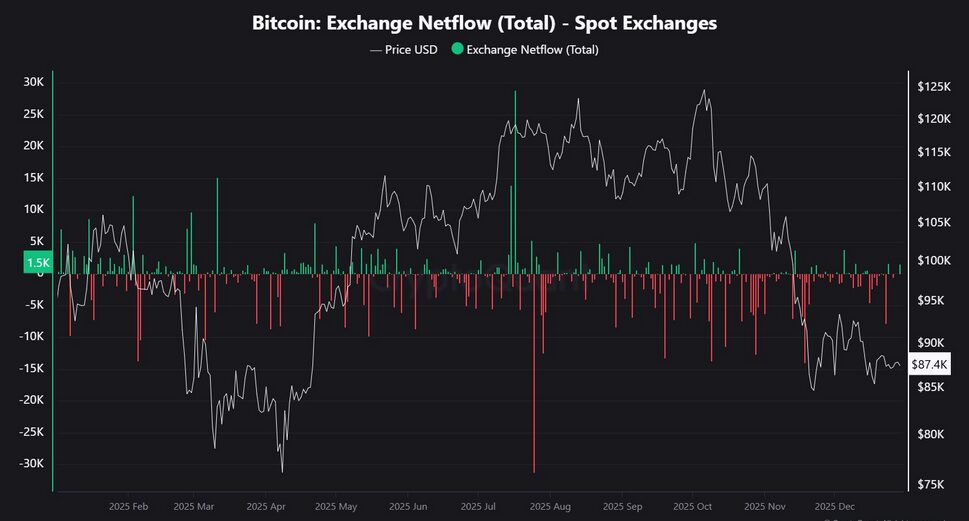
Exchange Netflow: Spot Supply and Demand
Exchange Netflow measures Bitcoin inflows and outflows from centralized exchanges, offering a direct view of spot market supply pressure.
In a range-bound environment, flows tend to alternate rather than trend decisively. Of particular importance is the behavior during price corrections. If net outflows appear during pullbacks, it suggests that real demand is absorbing supply, reinforcing the integrity of the range structure.
[Exchange Netflow vs. Bitcoin Price]
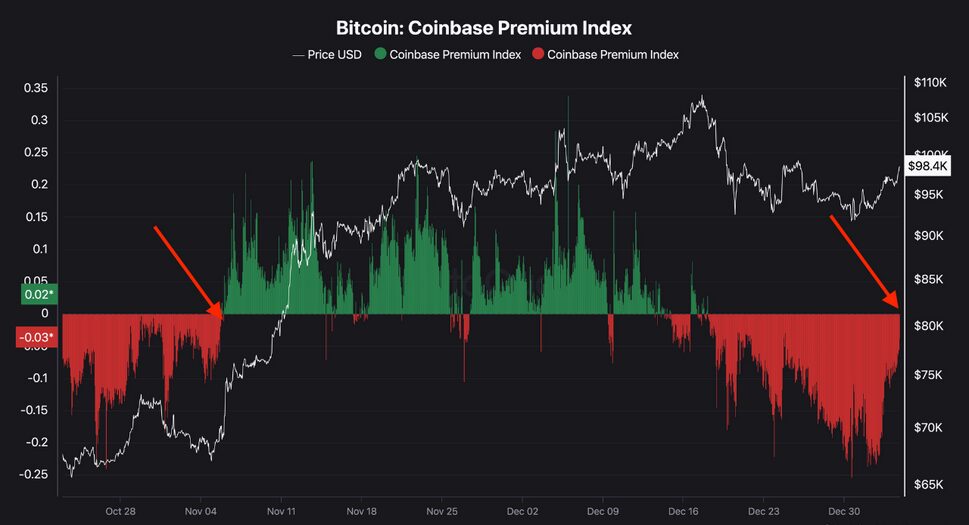
Coinbase Premium Index: U.S. Institutional Demand
The Coinbase Premium Index serves as a proxy for U.S.-based spot demand and indirectly reflects ETF-related flows.
During range markets, the premium often oscillates between positive and negative values. The key signal lies not in trend formation, but in resilience. If the premium does not collapse deeply negative during corrections, it implies that U.S. capital—including ETF participants—has not fully exited the market.
[Coinbase Premium Index]
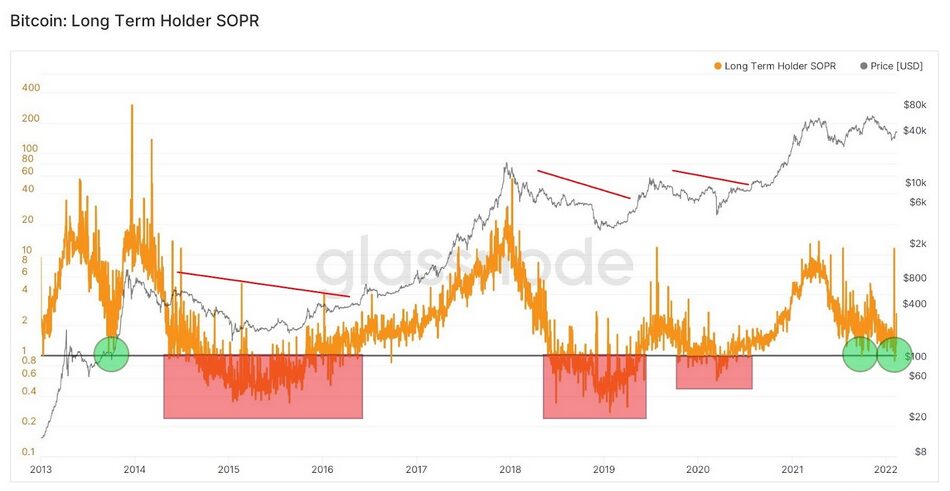
SOPR: Behavioral Structure of Market Participants
The Spent Output Profit Ratio (SOPR) reveals whether coins are being spent at a profit or a loss, capturing the psychological state of market participants.
In a healthy range scenario, short-term holders (STH) may frequently sell at a loss, pushing SOPR below 1 during volatility. Meanwhile, long-term holders (LTH) tend to maintain SOPR near 1, signaling conviction and structural stability.
This divergence suggests noise-driven movement rather than true distribution, consistent with a prolonged consolidation phase.
[SOPR for Short-Term and Long-Term Holders]
4. Conclusion: Defining the Market, Not Predicting It
As of now, the most coherent interpretation of the 2026 Bitcoin market is one of continued range behavior. This view remains valid as long as on-chain data confirms stable demand without decisive trend formation.
Should flows, leverage, or structural indicators shift meaningfully, this framework must be reassessed. The objective is not to predict the future with certainty, but to continuously define the present with precision. That discipline, more than bold forecasts, will determine success in navigating Bitcoin through 2026.
