Key Takeaways:
- Bitcoin has risen ~700% from the November 2022 low of ~$15,500 to an all-time high near $124,500, mirroring past cycles within 2–3 months of a top.
- On‑chain indicators—including percentage of supply in profit, realized profits by long‑term holders, and rotation from long‑term to short‑term holders—suggest waning momentum consistent with a late bull cycle.
- Technical resistance around $114,000–$117,000 is proving difficult to overcome; failure to hold key support zones could lead to a pullback toward $90,000–$100,000.
- Traders are exhibiting reduced conviction; both spot volumes and futures aggression are declining, pointing to consolidation rather than explosive continuation.
- Nonetheless, some analysts anticipate an extended bull phase possibly stretching into 2026 or 2027, driven by institutional demand and regulatory tailwinds.
1. Historic Cycle Patterns and On-Chain Signposts
Since its low of approximately $15,500 in November 2022, Bitcoin soared nearly 700% to an all-time high of about $124,500. This trajectory closely resembles previous cycles (e.g. 2015–2018, 2018–2022), where bull tops tend to materialize roughly two to three months after similar metrics were reached—and now we appear to be in that window.
Glassnode’s on-chain data further underscores this late-stage cycle signal: roughly 91% of Bitcoin supply is now in profit, and price has held more than +1 standard deviation above its mean for over 273 days—second only to the longest stretch from the 2015–2018 cycle. Simultaneously, realized profits by long-term holders have accelerated, matching or exceeding past cycles’ exuberance.
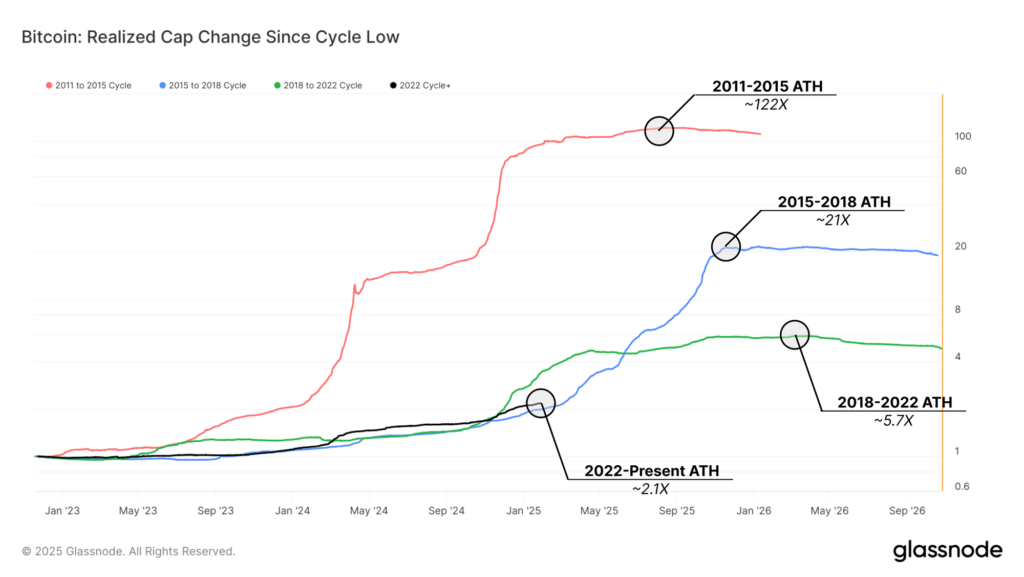
Capital rotation metrics—tracking the flow from long-term to short-term holders—show a distribution wave similar in scale to 2017 and 2021 rallies, indicating exhaustion of buying pressure.(Insert image here – Use image of on-chain cycle metrics chart)
Figure 1: On-Chain Indicators Showing Long-Term Holder Profit-Taking and Realized Cap Trends
2. Technical Resistance and Support Levels
Bitcoin’s attempt to consolidate above ~$114,000 is facing stiff resistance. Recent declines have pulled it back to the $112,000–$113,000 range, where support is weak despite overlapping with the 100‑day moving average.
Shorter-term moving averages—50‑day and 100‑day SMAs—hover near ~$117,000, forming overhead resistance. A sustained break below these levels could open the way to psychological support zones around $110K, and potentially a deeper decline toward $90K–$100K if breached.
3. Market Behavior, Volume, and Speculative Sentiment
Trading behavior reflects waning speculative fervor. Spot volumes near the recent high are noticeably muted compared to prior cyclical peaks, while futures continue to trade but with decreasing aggression—funding rates and term basis are on a downtrend.
Moreover, retail activity is cooling sharply. Retail transfers have dropped to the lowest levels seen since the 2021 peak, reminiscent of late-cycle behavior. Rekt Capital even notes that bull-trend upswings typically reverse within five to seven weeks—Bitcoin’s current rally appears to have reached that threshold.
In Reddit commentary, entrenched long-term holders remain confident, reinforcing the “buy‑the‑dip” mentality despite near-term pressures:
“BTC DIP BELOW $114K, BUT CONVICTION REMAINS STRONG AMONG HOLDERS”.
4. Macro Factors and Institutional Tailwinds – Extending the Cycle?
Not all signs point toward an imminent end. Some market watchers, such as Bernstein analysts, project that the bull market could stretch much longer—possibly peaking in 2027 instead of following the traditional four-year cycle. Their bullish case is anchored in strong regulatory support, such as the Genius Act, SEC initiatives, and the establishment of a federal Bitcoin reserve—elements designed to elevate U.S. status as a crypto hub.
Still, critics caution against relying on an unusually prolonged cycle; macroeconomic conditions (like interest rates and liquidity), not just halving rhythms, increasingly influence Bitcoin’s trajectory.
Traders are also reacting to macro uncertainty around the upcoming Powell speech at Jackson Hole. Profit-taking intensified, with the price retreating ~10% from the ~$124K high. Spot selling is visible as spreads between Coinbase and Binance widen; options pricing reflects increased caution.
5. Summary: Navigating Bitcoin’s Bull Cycle Twilight
- On‑chain metrics align with a late-cycle narrative: profit-taking, high supply in profit, and capital rotation all point to waning bullish momentum.
- Technical analysis reveals a fragile footing around $114,000–$117,000; losing these levels may invite deeper correction.
- Market dynamics such as fading spot volume, declining retail participation, and speculative fatigue support a consolidation scenario.
- Institutional and regulatory support, however, could extend the cycle, potentially pushing the peak into 2026 or 2027.
- Macro catalysts, particularly Federal Reserve policy shifts and investor sentiment, could ultimately tip the balance in either direction.
Conclusion
Bitcoin’s parabolic run—from ~$15,500 to ~$124,500—places it squarely in late-cycle territory according to historical and on-chain benchmarks. The convergence of exhausted buying behavior, weakening technical level retention, and subdued volume signals that the bull market is likely nearing its end—though not necessarily imminently. Institutional demand and favorable regulatory momentum offer a counterbalance that could sustain the rally. In the weeks ahead, vigilance around key support levels, macro policy developments, and sudden volume shifts will be critical for anyone seeking to time entries or navigate this complex, evolving landscape.
