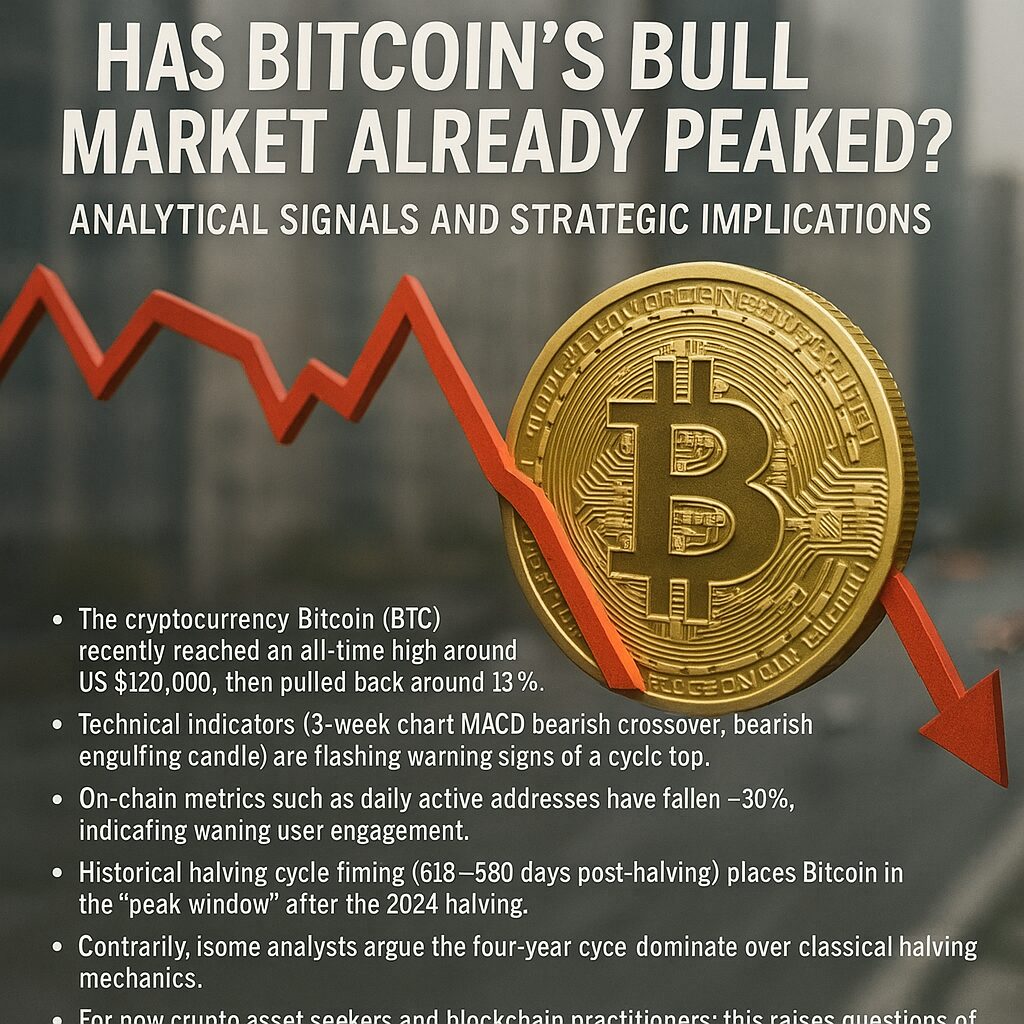
Main Points :
- The cryptocurrency Bitcoin (BTC) recently reached an all-time high around US $126,000, then pulled back around 13 %.
- Technical indicators (3-week chart MACD bearish crossover, bearish engulfing candle) are flashing warning signs of a cycle top.
- On-chain metrics such as daily active addresses have fallen ~30 %, indicating waning user engagement.
- Historical halving cycle timing (518–580 days post-halving) places Bitcoin in the “peak window” after the 2024 halving.
- Contrarily, some analysts argue the four-year cycle still holds, institutional inflows remain strong, and upside to ~$140k-$180k or beyond remains.
- Macro, institutional and regulatory factors may now dominate over classical halving mechanics.
- For new crypto asset seekers and blockchain practitioners, this raises questions of risk management, altcoin opportunity, and using network signals rather than purely timing Bitcoin.
1. Recent Price Action and Technical Red Flags
Bitcoin’s surge to roughly US $126,000 in early October 2025 followed by a ~13 % drop has prompted debate as to whether the current move marked the top of this cycle. According to one recent summary: “Bitcoin traded 3 % lower on Thursday and 13 % below its US$ 126,000 all-time high reached on Oct. 6, with some traders suggesting that this level may have marked the cycle top.”
Analyst Jesse Olson points to the 3-week BTC chart showing a bearish MACD crossover (MACD line falling below signal line) and a bearish engulfing candle, echoing similar patterns observed at the peaks of 2017 and 2021 cycles.
Other signals include the histogram of the MACD showing a longer-term divergence. He argues: “These and several other warning signs suggest that the top is in.”
For asset seekers, this means the risk-reward in BTC may be shifting: the upside might be more constrained, while downside risk (or extended consolidation) is rising.
2. On-Chain Metrics: Waning Engagement
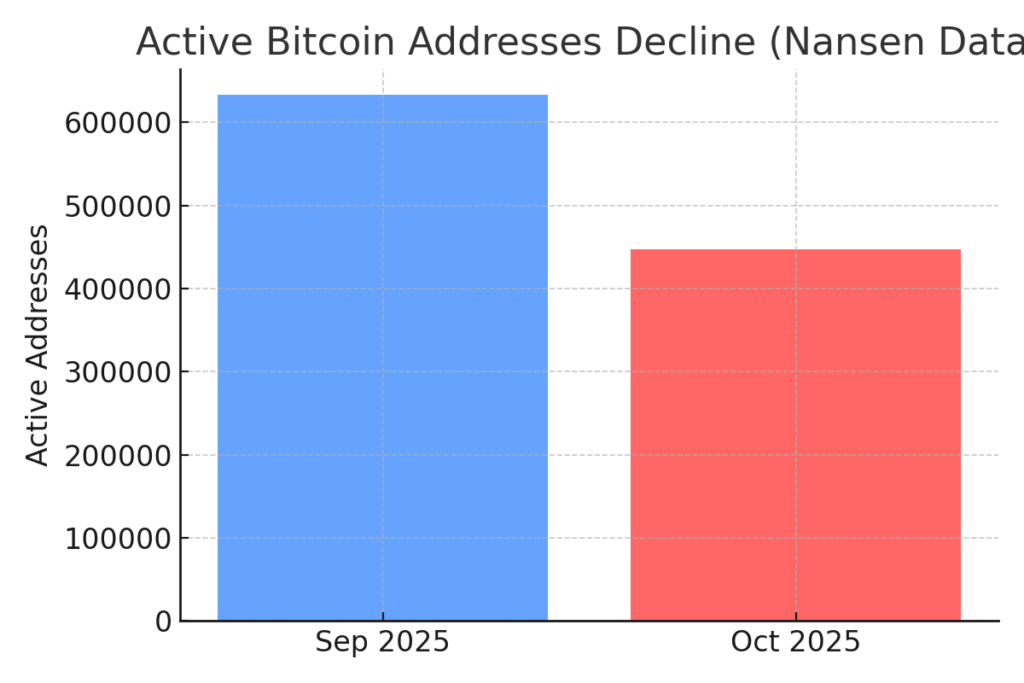
Technical warnings are complemented by on-chain indicators. For example, the analytics platform Nansen reports that active addresses in October fell to ~447,225 from ~632,915 in September — a ~30 % drop.
Falling active addresses may signal reduced user demand, and historically such drops have preceded consolidation or corrections rather than fresh parabolic rallies. In practical blockchain-use terms, if network activity contracts, the case for broad speculative upside weakens.
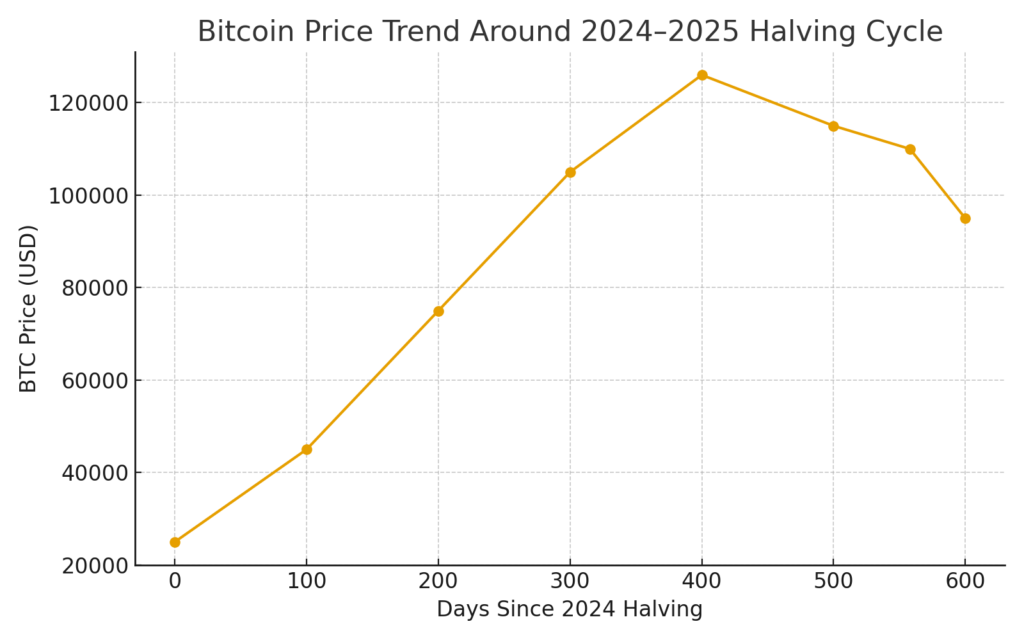
3. Halving Cycle Timing: Are We At the Peak Window?
A core narrative of Bitcoin’s bull markets has been the halving-to-peak timeline. Observing previous cycles: the 2012 and 2016 halvings saw peaks around 518–580 days later. This time, the 2024 halving has already passed 558 days — placing Bitcoin already inside that historic peak window.
One anonymous trader, Mister Crypto, asserts: “We are right around the time where Bitcoin historically peaks out. Will this time be different?”
That suggests that from a pure cycle-model perspective, the bull run may already be at or near its apex. For practitioners evaluating new assets, this means assuming a continuation of the same high-growth pattern in BTC may carry elevated risk.
4. The Four-Year Cycle Debate: Dead or Alive?
Despite the above, not all analysts believe this cycle top is locked in. For instance, an article from Bitget notes that the four-year cycle still may hold and that institutional participation may alter timing but not phase.
Conversely, some (like Arthur Hayes of BitMEX) argue that the four-year rhythm is outmoded – liquidity, monetary policy and institutional flows now override the halving schedule.
From a strategic perspective, this debate is critical: if the halving-peak framing is still valid, then early entry and upside in BTC may be limited; if institutional and macro factors dominate, then upside remains but timing and risk change. For investors seeking the next asset, this means a scenario-based approach is required.
5. Institutional Adoption, Shrinking Returns and Emerging Themes
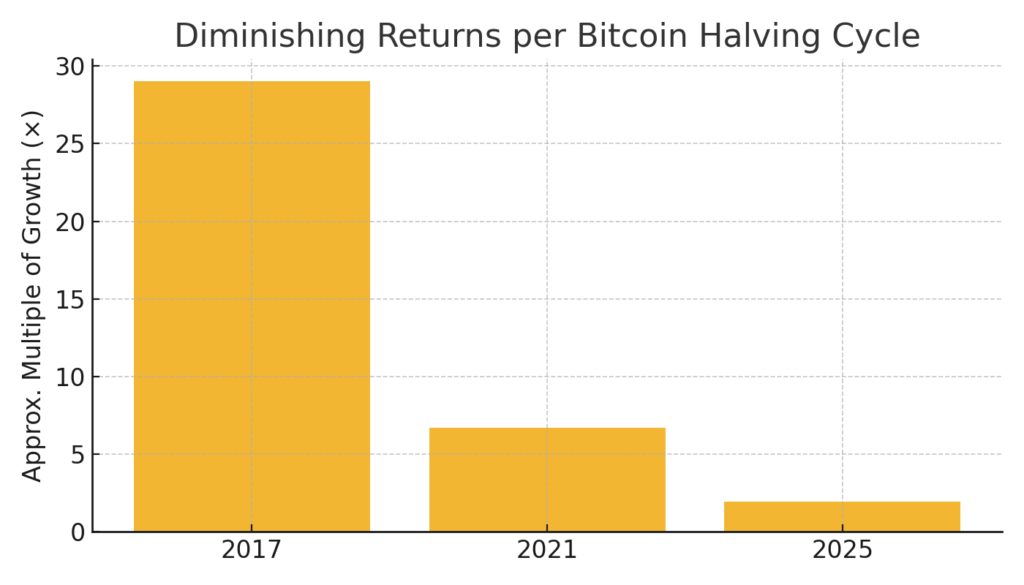
Beyond timing, structural changes in the Bitcoin ecosystem matter. A recent piece from CryptoPotato emphasises that each halving cycle delivered smaller gains — for example, the second halving cycle (2017) brought a ~29× return, the 2021 cycle ~6.7×, and the current cycle thus far ~93 % increase.
At the same time, institutional adoption has grown significantly: publicly listed companies hold >1,040,000 BTC, representing nearly 5 % of circulating supply, with firms like MicroStrategy or Strategy accounting for large portions.
These shifts imply that while upside multiple of BTC may be shrinking, the narrative supports a more mature institutional asset. For blockchain-practitioners and altcoin seekers, this signals a potential pivot: the “easy rally” in BTC may be behind us, and newer assets or protocols may offer asymmetric upside.
6. Macro-Liquidity, Regulatory & Business-Cycle Risks
Going deeper into the divergence from classical frameworks, analysts are pointing to macro-liquidity and business-cycle risk as dominant drivers of crypto now. For instance, one report argues that the next bear market may be driven not by halving mechanics but by global business-cycle contraction (M2 liquidity decline, recession risk).
In short: although the halving reduces issuance, if global liquidity tightens (e.g., central bank rate hikes, credit contraction), BTC and broader crypto risk being treated more like high-beta assets rather than inflation hedges. That means for someone interested in “next income sources” or “practical blockchain use,” it’s prudent to monitor macro signals at least as much as on-chain signals.
7. Strategic Implications for Asset Seekers & Blockchain Practitioners
Given the mixture of signals, what should someone interested in new crypto assets and practical blockchain applications do? Here are several take-aways:
- Risk control over chase: With BTC possibly at or near a cyclical top, allocations to new crypto assets should consider this as a period of higher risk. Scaling in gradually, using stop-losses or hedges, is prudent.
- Look beyond Bitcoin: If upside in BTC is constrained, new assets that apply novel blockchain use-cases (Layer 2s, cross-chain bridges, DeFi primitives) may offer better asymmetry.
- Use on-chain and technical signals: Monitor signals like MACD crossovers (for major assets), active address trends, and exchange outflows (supply squeeze). These may give early indications of trend shifts.
- Consider macro/liquidity environment: If the next downturn is driven by global liquidity or business-cycle risk rather than crypto-specific events, then blockchain applications tied to real-world usage (payments, tokenised assets) may outperform purely speculative tokens.
- Institutional adoption as trigger: When custody, spot ETFs, treasury holdings expand, infrastructure tokens or protocols which serve institutional flows may gain. For example, tokenised treasury services, institutional wallet infrastructure, or settlement layer protocols might see growth.
- Be ready for consolidation: If the cycle top is in, then a protracted consolidation phase may follow rather than a rapid crash. In such a phase, assets that generate yield (staking, DeFi protocols, real-world-asset tokens) may offer alternative income sources compared to price-only speculation.
8. Outlook: What Could Happen Next?
Synthesising the signals:
- Scenario A: Top Confirmed — BTC remains near this level or pulls back to the US $90,000-110,000 range, entering a consolidation or mild bear phase. In this case, altcoins could lead a new cycle or usage-based tokens may shine.
- Scenario B: Bull Continues — Institutional flows and macro easing push BTC to US $140,000-US $180,000+ by end of 2025 or early 2026. This would imply existing cycle mechanics persist but are elongated or amplified by new structural factors. Aurpay+1
- Scenario C: Macro Shock Disrupts — Global liquidity contraction, recession or regulatory shock hits markets broadly. Bitcoin acts as a risk asset rather than safe-haven, dragging many blockchain projects with it.
For practitioners and investors seeking new assets or blockchain utility, scenario-planning is key. Designing your strategy around trend reversal signals (rather than blindly continuing the past cycle) gives you flexibility.
Conclusion
The recent rally in Bitcoin to roughly US $126,000 followed by a pullback, combined with technical warnings (MACD crossover, bearish candles) and on-chain metrics (active addresses down ~30 %) suggest that this cycle’s top may have been reached. Historical halving-based timing supports this possibility. At the same time, structural changes — institutional adoption, shrinking return multiples, macro regimes — mean that the classical four-year cycle is no longer guaranteed, and upside may remain under a different dynamic.
For those exploring new crypto assets or real-world blockchain use-cases, the key takeaway is: don’t assume easy upside in Bitcoin alone. Instead, apply rigorous risk control, monitor both on-chain and macro signals, and look for protocols or assets offering real utility (payments, tokenised assets, infrastructure) especially in a possibly consolidating market environment. The next big opportunity may not be in riding Bitcoin higher, but in positioning for the next phase of blockchain adoption and yield generation.
