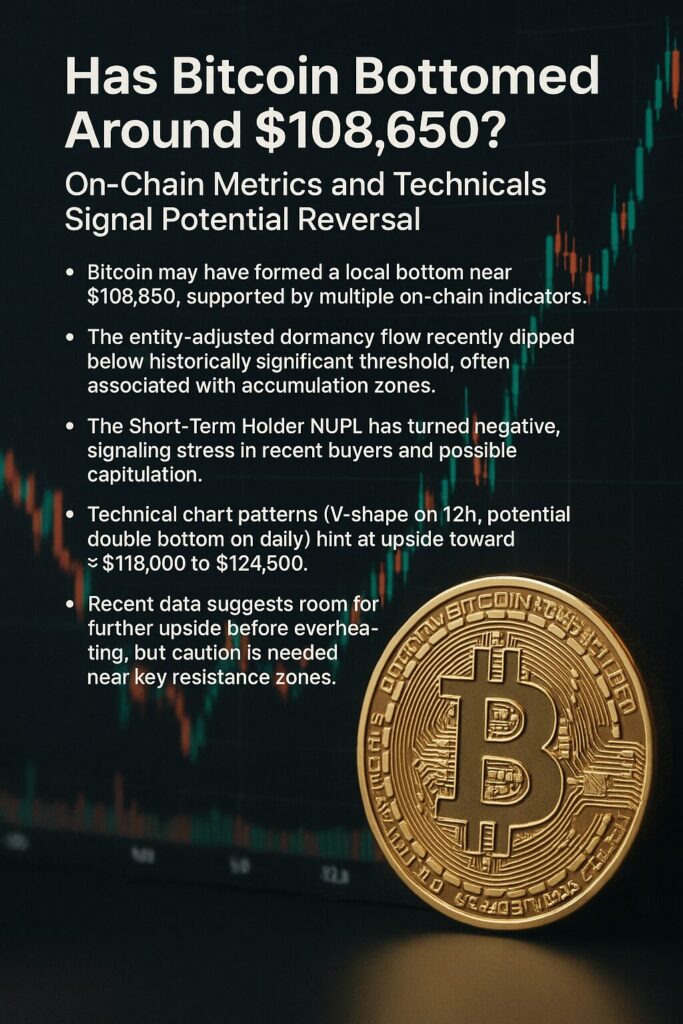
Key Points :
- Bitcoin may have formed a local bottom near $108,650, supported by multiple on-chain indicators.
- The entity-adjusted dormancy flow recently dipped below historically significant threshold, often associated with accumulation zones.
- The Short-Term Holder NUPL has turned negative, signaling stress in recent buyers and possible capitulation.
- Technical chart patterns (V-shape on 12h, potential double bottom on daily) hint at upside toward ≈ $118,000 to $124,500.
- Recent data suggests room for further upside before overheating, but caution is needed near key resistance zones.
1. Entity-Adjusted Dormancy Flow: a Bottom Signal?
One of the more telling indicators in recent discussion is the entity-adjusted dormancy flow. This metric refines the classic dormancy flow by excluding “in-house” or internal transfers within the same entity, focusing only on economically meaningful movement.
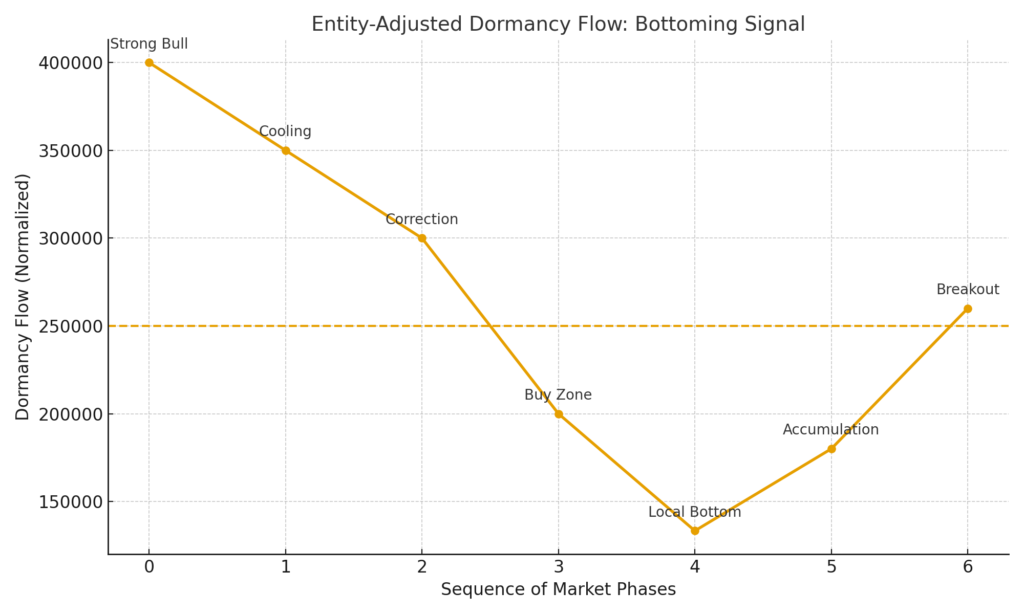
In recent days, this indicator has fallen to ~133,300, well below the commonly watched threshold of 250,000, which in historical contexts has correlated with favorable buy zones or bottoms.
Historically, when this metric plunged and later broke back above 250,000, it often coincided with strong bullish reversals. One noted example is the mid-2021 cycle, when the dormancy metric entered its “green zone” and preceded Bitcoin’s run toward ~$69,000.
Thus, the sharp drop (and possible stabilization) in entity-adjusted dormancy flow is being interpreted by some analysts as evidence that the market’s worst may already be behind us.
2. Short-Term Holder NUPL: Capitulation or Reset?
Another important on-chain metric is the Short-Term Holder Net Unrealized Profit/Loss (STH-NUPL), which focuses on UTXOs held for less than 155 days.
Recently, this metric has turned negative, meaning that newly acquired coins are, in aggregate, sitting at a loss. This is often interpreted as a sign of seller exhaustion—recent buyers are under stress, and many could capitulate or liquidate. Glassnode and on-chain commentators note that such negative readings frequently align with market resets and the onset of new accumulation phases.
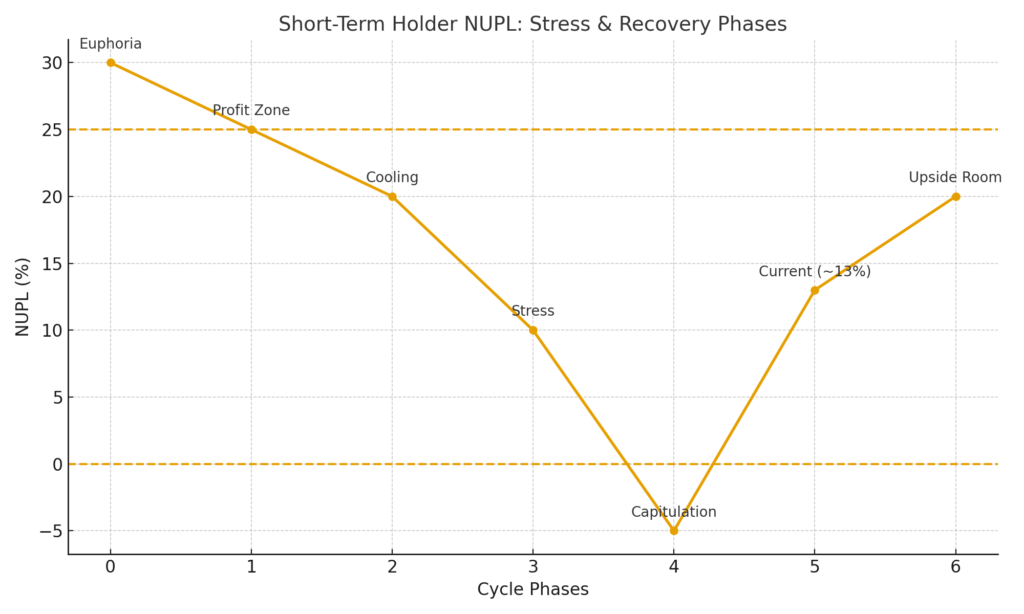
In prior cycles, negative STH-NUPL readings have coincided with local bottoms. For instance, after a downturn below ~$75,000, a negative STH-NUPL was followed by a 65% rally in six weeks.
However, looking at more recent data, some analysts argue that STH-NUPL is not yet overheated. For example, as of mid-2025, the STH-NUPL was ~13%, well below speculative euphoria levels (like 25%), indicating further upside before crowd-profit taking begins.
Hence, the narrative is: short-term holders have taken losses or are under pressure, which may purge weak hands and set the stage for sustained accumulation by longer-term players.
3. Technical Patterns: V-Shape Reversal & Double Bottom
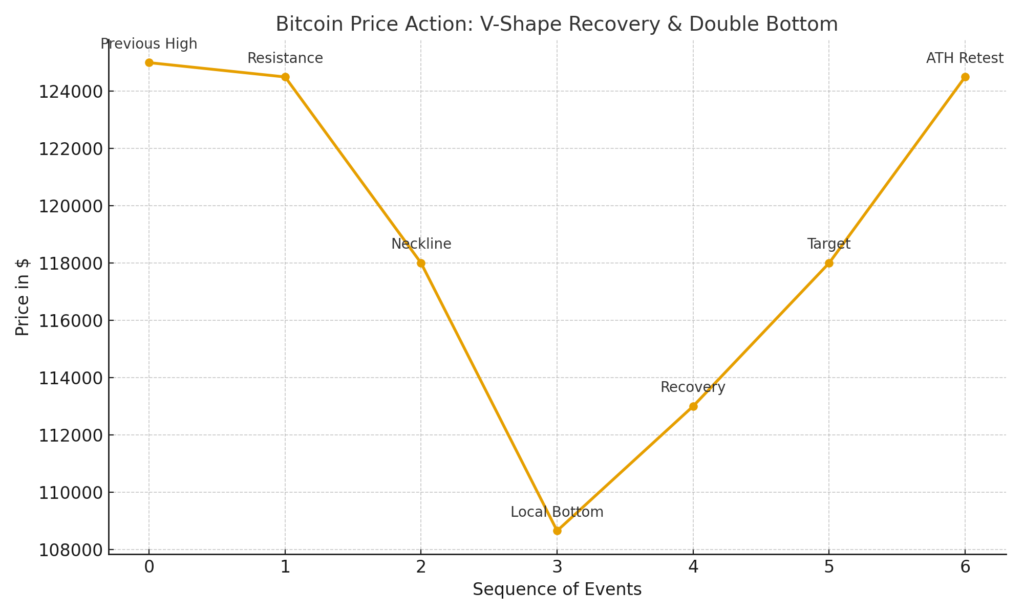
From a price-chart perspective, Bitcoin’s recent action is showing hallmarks of a reversal:
- On the 12-hour timeframe, beginning around September 18, BTC has traced a V-shaped recovery. After dropping ~7.8% to $108,700, buyers stepped in and pushed prices back up, forming a sharp reversal. The Relative Strength Index (RSI) rose from oversold (~27) to around 53, signaling renewed momentum.
- If this V-shape fully confirms, a target toward the “neckline” around $118,000 is possible — implying another ~4% upside from current levels.
- On the daily chart, a double bottom structure appears to be forming. If Bitcoin breaks above the ~$118,000 resistance, the next upside target is often cited near ~$124,500 (which would represent ~10% from current levels).
- Analysts like Matthew Hyland point out that the market structure is becoming clearer—if the double bottom or inverted head-and-shoulders patterns confirm, the upward breakout could be decisive.
Together, the interplay of on-chain metrics and price patterns gives a plausible case for a shift from bearish to bullish conditions.
4. Recent Developments & Broader Context
While the original article focuses on the bottoming thesis, several newer data points and market dynamics are worth adding:
- As mentioned above, recent commentary suggests STH-NUPL at ~13% is not yet at levels associated with speculative excess, indicating room for further price growth before profit pullbacks.
- Some analysts posit that Bitcoin would need to climb to ~$137,000 before mass short-term selling begins (i.e. STH-NUPL approaching ~25%).
- Reduced exchange reserves and institutional accumulation are also being spotlighted as supportive factors in recent reporting, suggesting that supply-side constraints may amplify upward pressure.
- In the academic domain, fresh research on Bitcoin’s holding-time distributions shows heavy-tailed behavior and long-memory effects, which supports the idea that coins tend to sit idle for long stretches during accumulation phases.
- That said, macroeconomic and regulatory risks remain nontrivial: global interest rate regimes, regulatory crackdowns, and macro sentiment (e.g. inflation or geopolitical stress) could still derail or delay the bullish thesis.
5. Summary & Outlook
Putting it all together:
Bitcoin’s recent dip to ~$108,650 is being eyed by analysts as a potential local bottom. The fall of the entity-adjusted dormancy flow into historically undervalued territory, combined with a negative STH-NUPL reflecting short-term holder stress, suggests that the market might be concluding a climax of selling. Technical chart structures—namely, a V-shape reversal on a shorter timeframe and a forming double bottom on daily charts—lend further credence to the idea of a trend reversal.
That said, the path higher is not guaranteed. Resistance zones around ~$118,000 and ~$124,500 must be overcome, and a speculative peak toward ~$137,000 may elicit fresh profit-taking. Institutional flows, supply dynamics, and external macro conditions will play major roles in determining how cleanly this transition to bullishness can occur.
For readers interested in exploring new crypto projects or yield mechanisms, the current environment may offer attractive entry points—especially for assets with strong fundamentals and real-world utility, as the market transitions out of a capitulation phase.
If you like, I can produce updated charts for the metrics (NUPL, dormancy flow, price patterns) or run similar analysis for promising altcoins.
