
Main Points :
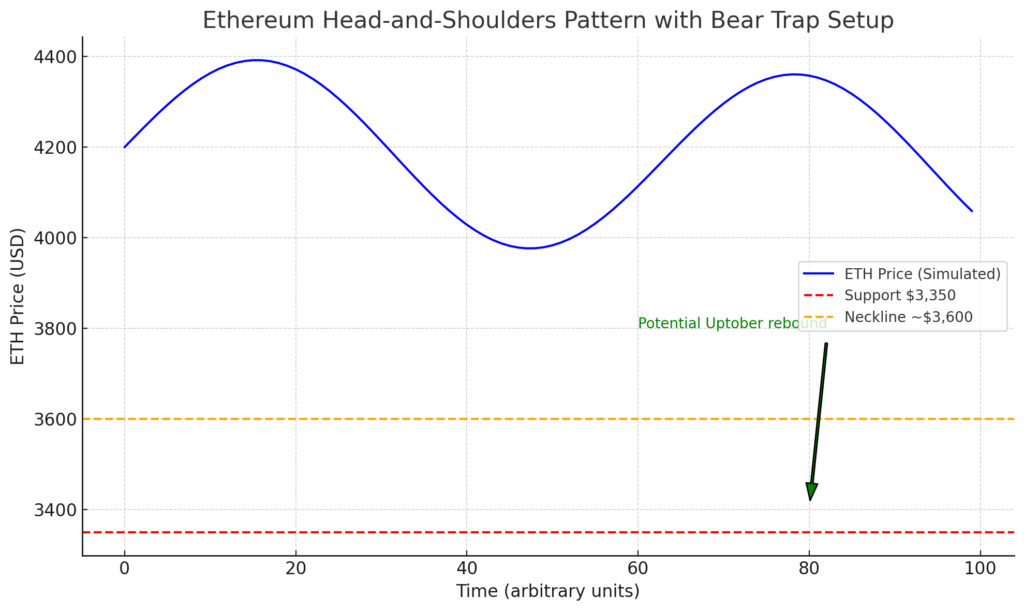
- September’s Weakness Could Be the “Biggest Bear Trap”: A head-and-shoulders pattern may lure sellers, only to be invalidated by a rebound in October.
- Historical Parallel to September 2021: Ether previously dropped ~30% (from $3,950 to $2,750) before rebounding to new highs by November.
- Critical Support Around $3,350: Analysts foresee a test of this level in September before recovery.
- Consolidation Range of $4,300–4,500: Price action remains unsettled, with key moving-average retests potentially signaling reversal points.
- Macro and Structural Fundamentals Matter: Institutional demand, stablecoin growth, Layer‑2 expansion, and regulatory clarity underpin ETH’s long-term strength.
- Potential for New All-Time High in November: If the bear trap plays out, ETH could continue toward fresh peaks late in the year.
- Balanced View Encouraged: Overreliance on chart patterns may overshadow fundamental catalysts—view both together.
1. September’s Bear Trap or Bearish Breakdown?
Ethereum is showing cautious signs of weakness as September unfolds. Leading crypto analyst Johnny Woo warns that while the current downturn may resemble a classic head-and‑shoulders pattern—a hallmark of bearish reversals—it might instead represent what he calls “the biggest bear trap” in recent history.
In this scenario, ETH could decline toward $3,350, triggering fear and short‑term selling, only for the trend to reverse sharply in October—invalidating the bearish pattern and potentially catapulting the price to new all‑time highs (ATH) by November.
2. Echoes of September 2021
This isn’t purely speculative. A strikingly similar event occurred in September 2021, when Ethereum fallen around 30%, dropping from about $3,950 to $2,750—only to recover and reach an ATH by November. That recovery lent credence to Woo’s analogy, offering technical traders a historical touchstone: dips can precede dramatic recoveries.
3. Critical Levels and Technical Signals
Another analyst, Daan Crypto Trades, highlights current price action in the $4,300–4,500 range as a consolidation zone that has “been chopping everyone up”. A retest of the $4,160 zone, aligned with the 4‑hour 200 Moving Average, could serve as a strategic bounce point for traders.
Further, a fall below ETH’s 20‑day EMA (~$4,378) might open the path to deeper support levels at $4,094 or even $3,745, as per technical analysis summaries. But on the upside, reclaiming $4,957 could reassert bullish dominance and pave the way toward $5,500 and beyond.
Suggested Chart Image: A simplified Ethereum head-and-shoulders pattern, marking the $3,350 support zone, neckline, and potential breakout path into “Uptober.” Place this in the text after the above paragraph.
(Insert image illustrating the potential pattern and price zones.)
4. Why Fundamentals Still Ignite Long-Term Confidence
While chart patterns generate headlines, true conviction may hinge on fundamentals.
- Institutional ETF Inflows: Spot ETH ETFs are absorbing large quantities—over 286,000 ETH in a single week, indicating strong institutional buy interest.
- Layer‑2 Ecosystem Growth: The rise of L2 solutions contributes to Ethereum’s scalability and network effect.
- Stablecoin Expansion and Regulation: As regulations clear and stablecoin adoption increases, Ethereum’s role in DeFi and payment rails is bolstered. OKX’s CEO Gracie Lin emphasizes this structural strength over short-term volatility.
- On‑chain Scarcity Signals: Supply contraction trends and strong validator queue metrics (as high as $4.96B in exit queues) support scarcity dynamics and long-term bull case.
Together, these fundamentals paint Ethereum not just as a speculative asset but as a core financial infrastructure.
5. The Big Picture: Setup for an October Signal
Pulling together both technical and fundamental threads, here’s a possible progression:
- ETH dips to ~$3,350 in early–mid September, resembling a head‑and‑shoulders breakdown (“bear trap”).
- Technical sellers capitulate, setting the stage for a rebound.
- In October, ETH invalidates the bearish setup, igniting aggressive buying—what many call “Uptober.”
- By early November, ETH potentially breaks into new ATH, fueled by broader market momentum and structural strength.
Conclusion
Ethereum appears to be at a pivotal juncture, where a technical bear trap could easily morph into a bullish upside opportunity. Traders seeking new crypto assets or sources of alpha should view September’s volatility as a potential setup, not a setback.
But wisdom lies in balancing technicals with strong fundamentals—institutional demand, ecosystem growth, and network effects remain powerful tailwinds that can sustain a durable uptrend. If Woo’s scenario unfolds, ETH may reaffirm its leadership in blockchain and become a symbol of patience rewarded.
