Main Points :
- Ethereum (ETH) is exhibiting macro and liquidity-driven signals that closely resemble the setup preceding its 2021 bull run.
- Global liquidity expansion and the breakout of the Russell 2000 index have historically preceded major ETH rallies.
- On-chain data suggests continued accumulation, with realized prices of accumulation addresses acting as a strong support level.
- If historical patterns repeat, ETH could enter a new breakout phase around early 2026.
- These signals matter not only for traders but also for investors seeking new crypto assets, yield opportunities, and practical blockchain adoption.
Introduction: Why Ethereum’s Current Setup Matters
Ethereum is once again at the center of market discussions as multiple indicators align in a way that strongly resembles the macroeconomic and liquidity environment of 2021. That year marked one of the most powerful rallies in Ethereum’s history, driven not just by speculation, but by global liquidity expansion, risk-on sentiment in equities, and accelerating real-world blockchain usage.
Today, analysts are pointing out that the same structural forces may be returning. Rather than focusing solely on short-term technical indicators, this analysis emphasizes liquidity cycles, equity market correlations, and on-chain behavior—factors that tend to define long-term trends in high-beta assets like Ethereum.
For readers searching for new crypto assets, the next source of returns, or practical blockchain use cases, understanding this setup is critical.
The 2021 Blueprint: How Ethereum’s Last Major Rally Unfolded
To understand why current signals are attracting attention, it is necessary to revisit Ethereum’s 2021 breakout.
In that cycle, three elements aligned in a specific sequence:
- Global liquidity expanded sharply as central banks maintained accommodative policies.
- The Russell 2000 index, representing U.S. small-cap stocks, broke out, signaling a broad risk-on environment.
- Ethereum followed with a delayed but explosive rally, outperforming most major assets.
Between March and November 2021, ETH surged by approximately 226%, rising from around $1,700 to over $4,800 at its peak. Importantly, this move did not occur in isolation. It coincided with DeFi adoption, NFT market expansion, and growing institutional awareness of Ethereum’s role as programmable financial infrastructure.
Global Liquidity: The Primary Driver Behind High-Beta Assets
Why Liquidity Matters More Than Short-Term Indicators
Global liquidity refers to the availability of capital in the financial system, influenced by central bank balance sheets, credit conditions, and money supply growth. Historically, increases in global liquidity have fueled rallies in high-risk, high-reward assets such as cryptocurrencies, emerging market equities, and technology stocks.
Analyst Sykodelic has highlighted that Ethereum tends to respond not immediately, but with a lag, to global liquidity breakouts. This delay often causes market participants to underestimate the magnitude of the subsequent move.
Current Liquidity Conditions
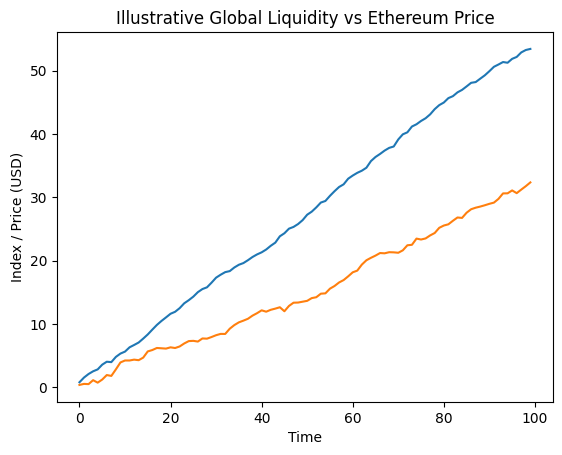
Recent data suggests that global liquidity has already broken out to the upside, mirroring conditions seen in early 2021. This breakout forms the first stage of the historical three-step pattern that previously preceded Ethereum’s major rally.
[Global Liquidity Index vs. Ethereum Price (USD)]
Russell 2000 as a Leading Indicator for Ethereum
The Risk-On Signal from Small-Cap Stocks
The Russell 2000 index has long been considered a barometer for investor risk appetite. When small-cap stocks outperform, it often signals confidence in economic growth and a willingness to allocate capital to higher-risk assets.
Both Sykodelic and Max, CEO of BecauseBitcoin, have emphasized that the Russell 2000 historically breaks out before Ethereum enters its price discovery phase.
A Familiar Pattern Reappears
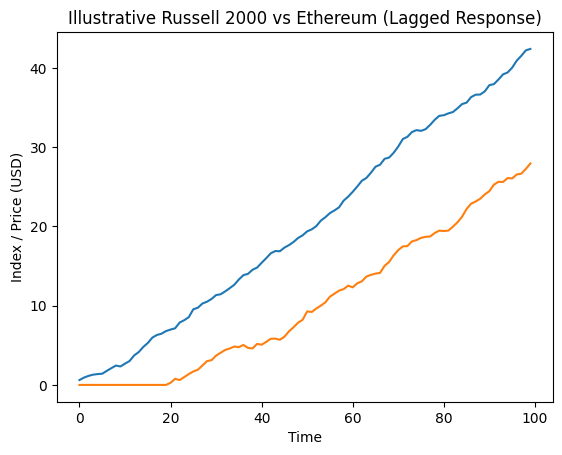
Recently, the Russell 2000 reached a new all-time high at approximately 2,738 points. In the previous cycle, ETH began its major rally roughly 119 days after the Russell’s breakout. If this timing holds, Ethereum could enter a decisive breakout phase around March 2026.
[Russell 2000 Monthly Chart vs. ETH Monthly Chart]
Ethereum’s Delayed Reaction: Why Timing Matters
Ethereum’s tendency to lag behind macro and equity signals is not a weakness—it is a characteristic of how capital flows into the crypto market.
Institutional and macro-driven investors often first allocate capital to equities and liquid risk assets. Once confidence builds, capital gradually rotates into cryptocurrencies, with Ethereum benefiting disproportionately due to its central role in DeFi, tokenization, and smart contract execution.
This lag creates opportunities for investors who focus on macro alignment rather than short-term price noise.
On-Chain Evidence: Accumulation Signals Strength
Accumulation Addresses and Realized Price
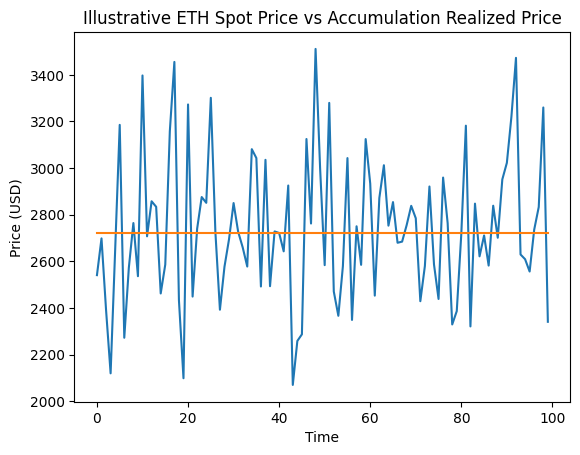
On-chain data from CryptoQuant shows that Ethereum accumulation addresses—wallets that consistently accumulate without significant selling—have a realized price of approximately $2,720.
The realized price represents the average cost basis of these holders and has historically acted as a strong support level during market corrections.
[ETH Realized Price of Accumulation Addresses (USD)]
Why This Matters for Long-Term Investors
When the spot price trades near the realized price of accumulation addresses, it suggests that long-term holders are confident and continue accumulating despite volatility. In previous cycles, ETH did not sustainably fall below this level during major bull phases.
This behavior reinforces the idea that Ethereum’s current price action is being underpinned by structurally strong demand rather than speculative excess alone.
Beyond Price: Practical Implications for Blockchain Adoption
Ethereum’s potential rally is not purely a speculative story. Since 2021, the network has matured significantly:
- Layer 2 solutions have reduced transaction costs and improved scalability.
- Tokenization of real-world assets (RWAs) has accelerated, with financial institutions experimenting with Ethereum-based settlement.
- Stablecoins, primarily issued on Ethereum and its Layer 2s, have become a critical component of global digital payments.
For readers interested in practical blockchain usage, Ethereum’s strength signals growing confidence in its role as financial infrastructure—not just a tradable asset.
Risk Factors and What Could Break the Pattern
While historical similarities are compelling, no cycle is guaranteed to repeat exactly. Key risks include:
- A sharp contraction in global liquidity due to unexpected monetary tightening.
- Regulatory shocks affecting DeFi, staking, or smart contract platforms.
- A breakdown in the correlation between equity risk appetite and crypto markets.
Investors should therefore view these signals as probabilistic rather than deterministic.
Conclusion: A Liquidity-Led Setup Worth Watching
Ethereum is once again flashing signals that closely resemble the conditions preceding its historic 2021 rally. Global liquidity expansion, a breakout in the Russell 2000, and strong on-chain accumulation collectively point to the possibility of a renewed upward phase.
For those seeking new crypto assets, future revenue streams, or exposure to practical blockchain infrastructure, Ethereum’s current positioning deserves serious attention. While timing remains uncertain, the structural alignment of macro, equity, and on-chain indicators suggests that the next major move may already be in preparation.
