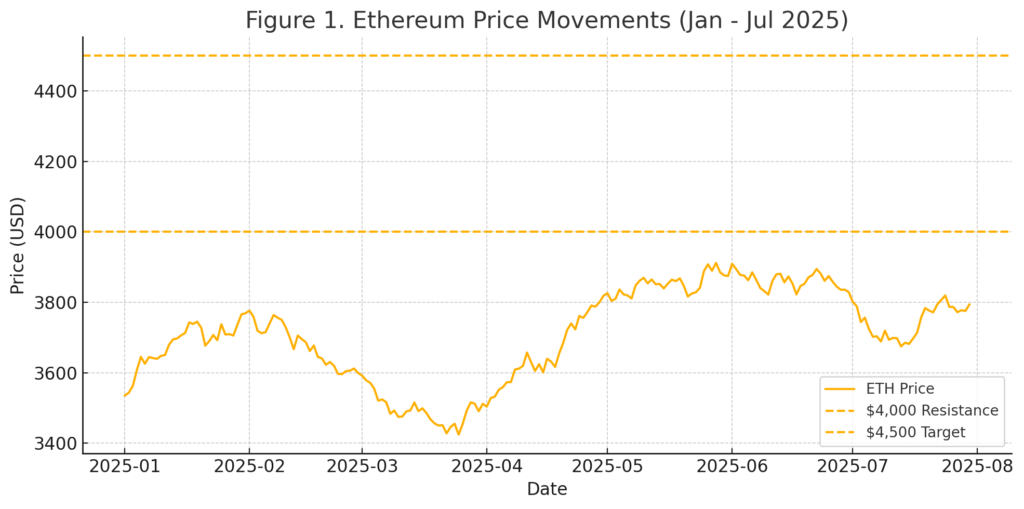
Persistent trading around the $4,000 resistance since December 2024, with bulls eyeing the +1σ realized price band near $4,500.
Ethereum perpetual futures volume has surpassed Bitcoin for the first time since 2022, marking the largest shift toward altcoins on record.
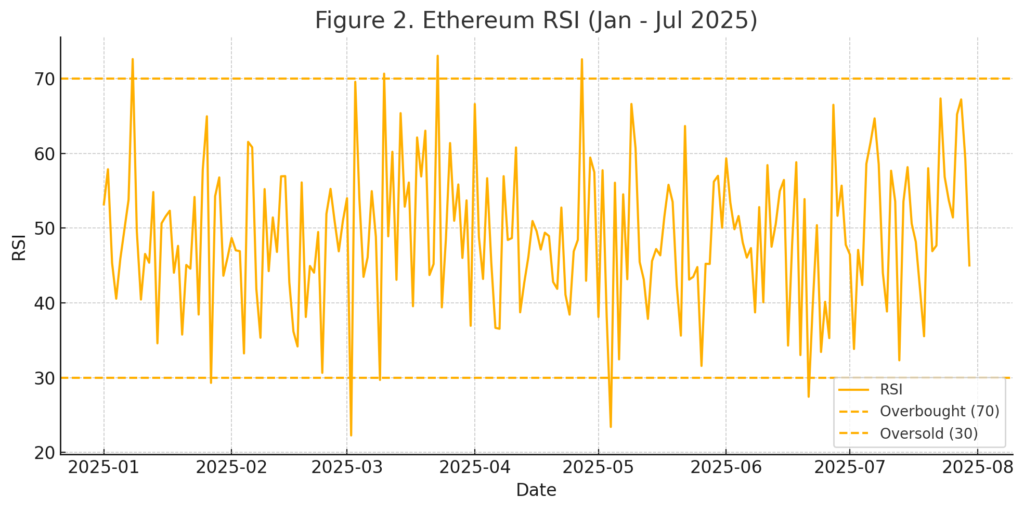
Bearish RSI divergence on both 4-hour and daily charts signals potential short-term pullback.
Key short-term support lies just below $3,700; deeper fair-value gap between $3,200–$3,300 if bearish momentum persists.
Institutional flows via ETH ETPs and on-chain stablecoin movements underscore growing confidence.
Practical takeaway: monitor breakout above $4,000 for a likely surge; use pullback zones for tactical entry.
Ethereum Price Dynamics
Since December 2024, Ethereum (ETH) has been locked in a tight battle around the $4,000 resistance level. Market participants are watching closely to see whether ETH can decisively clear this barrier, which historically acts as a significant supply zone and sentiment pivot point. Bulls, meanwhile, have set their sights on the +1σ active realized price band—an on-chain metric reflecting the average cost basis of coins changing hands—currently positioned near $4,500. This band has previously acted as both trigger and ceiling, spurring rapid rallies when breached but also heightening structural volatility.
Insert price chart image here:
Location: Immediately after this paragraph.
Futures Market Shift
A pivotal development reinforcing bullish conviction is Ethereum’s overtaking of Bitcoin in perpetual futures trading volume. For the first time since 2022, ETH’s daily perp volumes have outstripped BTC’s, marking the most pronounced volume skew ever recorded in favor of an altcoin. According to Phemex, Ethereum attracted $1.59 billion in fresh futures inflows, contributing to year-to-date inflows of nearly $7.8 billion, while ETH ETPs logged another $1.9 billion in institutional investments. This rotation of speculative capital highlights heightened risk appetite and suggests that institutional desks are piling into ETH-related products.
Technical Indicator Analysis
While on-chain and volume data point toward sustained bullish momentum, technical signals warrant caution. Both 4-hour and daily relative strength index (RSI) readings exhibit bearish divergence: ETH’s price has made fresh local highs, yet RSI levels have not followed suit, hinting at waning upside momentum and possible profit-taking ahead of a meaningful correction. Historically, such divergences at major resistance levels precede pullbacks or consolidation phases before the next leg higher.
Insert RSI divergence chart image here:
Location: Immediately after this paragraph.
Support and Resistance Levels
In the event of a pullback, short-term support is expected just below $3,700—where a narrow fair-value gap (FVG) has formed, often acting as a magnet during corrections. Should bearish momentum deepen, ETH may retrace toward the larger FVG zone around $3,200–$3,300, a level that could trigger renewed accumulation or risk a deeper breakdown if market sentiment sours. Conversely, a daily close above $4,000 on strong volume would likely liquidate up to $930 million in short positions clustered around that threshold, potentially igniting a swift run to $4,500.
Broader Market Context
The ETH vs. BTC futures flip is part of a larger altcoin rotation. CoinCentral reports that around 41% of top-50 altcoins are outperforming Bitcoin, signaling that an official “altcoin season” may be underway once this figure reaches 75%. Additionally, increased stablecoin flows on the Tron network and declining exchange reserves indicate capital moving off-exchange into DeFi and spot markets, providing fuel for altcoin rallies.
Institutional interest is also climbing: VanEck noted that ETH ETPs gathered over $2.2 billion in mid-July 2025 crypto week, underlining investor confidence in Ethereum’s long-term narrative of smart contracts, staking yields, and DeFi growth.
Practical Implications for Investors
For those scouting new crypto assets or seeking additional revenue streams, the current ETH setup offers several tactical considerations:
Breakout Entry: A decisive daily close above $4,000 with elevated volume can serve as a trigger for long positions, with profit-taking targets near $4,500 and stop-losses placed below $3,900.
Pullback Accumulation: Should a short-term correction unfold toward $3,700–$3,800, this zone provides an attractive entry for buyers seeking to average in ahead of the next rally.
Risk Management: Monitor RSI and volume divergence closely; consider scaling out if bearish divergence persists despite price strength.
Diversification: With institutional flows rotating into other altcoins, explore altcoin pairs that mirror ETH’s strength or benefit from Ethereum-related DeFi ecosystems, such as Layer-2 tokens and staking derivatives.
Conclusion
Ethereum stands at a critical juncture. The $4,000 level has proven to be both a battleground and a launchpad, while the $4,500 realized price band looms as the next major hurdle. Institutional flows into futures and ETFs, coupled with on-chain metrics, affirm bullish underpinnings. Yet, technical divergences counsel prudence and the readiness to capitalize on corrections. Investors equipped with clear entry/exit rules and an understanding of support/resistance dynamics will be well-positioned to navigate the current market rotation and potentially unlock the next wave of blockchain-driven returns.
About Us and Media
Blockchain and cryptocurrency media covering and exposing the practical application development on the blockchain industry and undiscovered coins.
Click edit button to change this text. Lorem ipsum dolor sit amet, consectetur adipiscing elit
Manage Consent
To provide the best experiences, we use technologies like cookies to store and/or access device information. Consenting to these technologies will allow us to process data such as browsing behavior or unique IDs on this site. Not consenting or withdrawing consent, may adversely affect certain features and functions.
Functional Always active
The technical storage or access is strictly necessary for the legitimate purpose of enabling the use of a specific service explicitly requested by the subscriber or user, or for the sole purpose of carrying out the transmission of a communication over an electronic communications network.
Preferences
The technical storage or access is necessary for the legitimate purpose of storing preferences that are not requested by the subscriber or user.
Statistics
The technical storage or access that is used exclusively for statistical purposes.The technical storage or access that is used exclusively for anonymous statistical purposes. Without a subpoena, voluntary compliance on the part of your Internet Service Provider, or additional records from a third party, information stored or retrieved for this purpose alone cannot usually be used to identify you.
Marketing
The technical storage or access is required to create user profiles to send advertising, or to track the user on a website or across several websites for similar marketing purposes.