
Main Points :
- Ethereum (ETH) has dropped ~7–8% amid broader market risk-off; breaking below $4,000 would significantly increase downside risk.
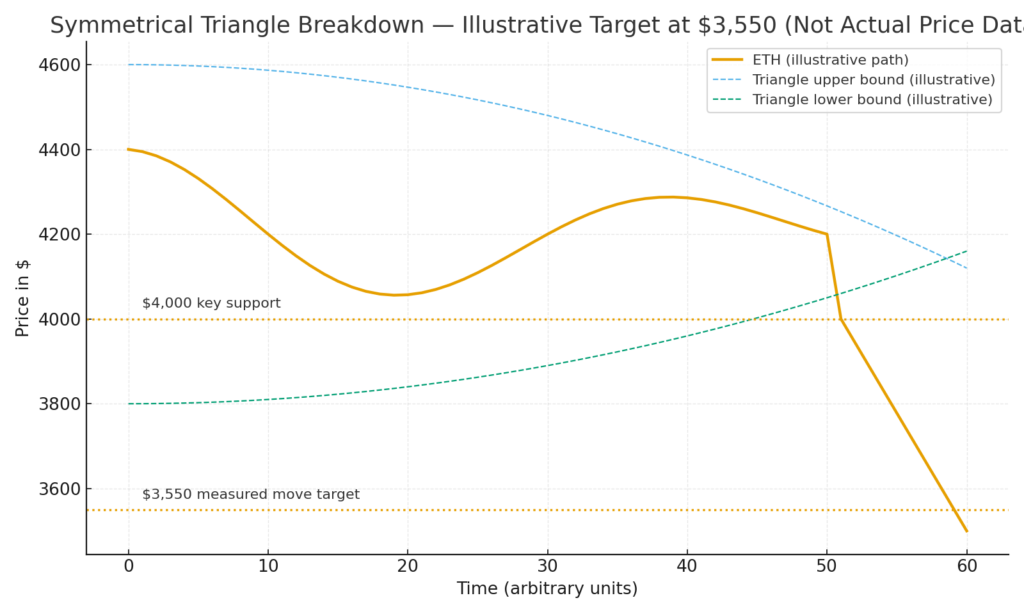
- Technical patterns (symmetrical / descending triangle, trendline support) suggest that $3,550–$4,000 is a critical support zone.
- On the upside, if ETH holds above its major trendline and clears resistance around $4,250–$4,500 (50-day EMA), gains toward $6,000–$7,000 become plausible.
- Institutional inflows, on-chain accumulation, and upgrades in the Ethereum protocol remain supportive fundamentals.
- Analysts differ: some are cautious, others bullish toward year-end; macro environment (interest rates, regulation) remains a wildcard.
Technical Setup & Key Patterns
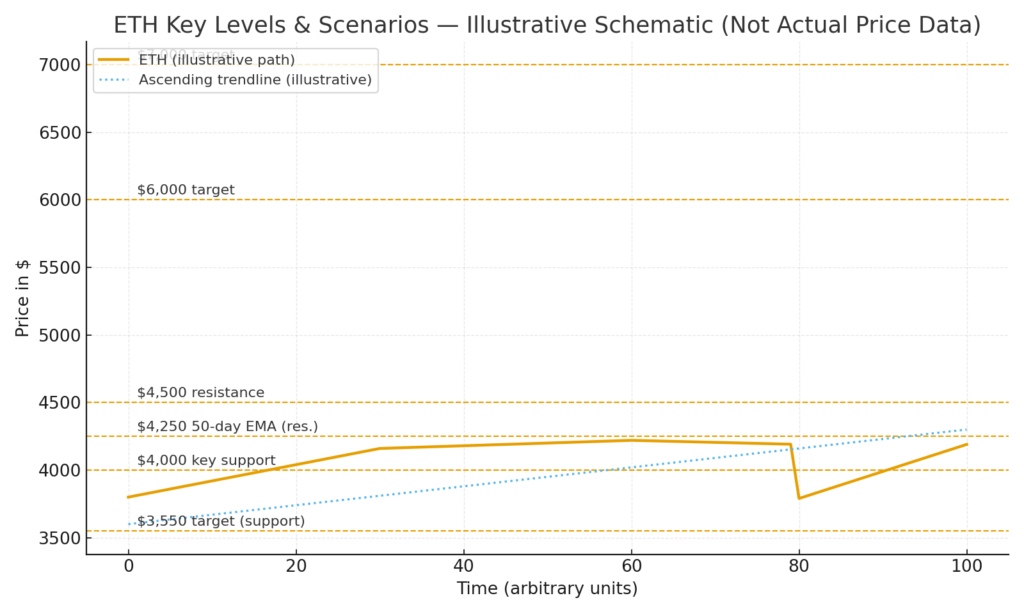
Ethereum’s recent price decline of ~7.5% reflects a broader pullback in risk assets. The technicals show that ETH has broken down from a symmetrical triangle (or more bearish if viewed as a downward-facing triangle), which often signals either continuation or reversal depending on breakout direction. In this case, the move is downward. The implied target from that breakdown sits around $3,550, assuming selling pressure persists. (This corresponds with analyst Mikaël van de Poppe’s support zone of $3,550–$3,750.)
However, ETH is hovering near a long-term ascending trendline which traces its up-move since April. Historically, this trendline has served as a launching pad for strong rallies (90-125% gains in past cycles). If this trendline holds, a bounce is possible. Also, the 50-day Exponential Moving Average (EMA) – roughly around $4,250 – is a key resistance to overcome for bulls to regain momentum.
Support Zones: $4,000 vs Risk of Falling Through
The most critical support zone for Ethereum is the $4,000 level. If ETH drops below it, risk of further downside opens up significantly. Current on-chain data shows institutional accumulation below this zone, which means there is “demand support” around there. Near-term support also exists around $4,200–$4,400, but those are weaker to moderate supports compared to $4,000.
If those upper support levels fail, a retest toward $3,500 becomes much more likely. That would represent another ~15-20% downside from where ETH is presently trading (mid-$4,000s), assuming no sharp bounce.
Upside Potential: Bounce Targets and Bull Scenarios
If Ethereum holds above its trendline support and decisively breaks through resistance at $4,250–$4,500 (including crossing above its 50-day EMA), then a bounce toward $6,000 is realistic for the next few months. More bullish analysts point to scenarios where ETH could ultimately reach $7,000 or more, especially if macro conditions (rates, regulatory clarity) align.
Some forecast even more extreme upside: for example, if a short-squeeze occurs (with large short open interest above resistance), ETH could accelerate its gains. Fundamental drivers such as rising usage (DeFi, stablecoins), ETF inflows, protocol upgrades, and better scaling (Layer-2, data availability, rollups) underlie these bullish outlooks.
Recent Developments & Analyst Views
Recent news and forecasts add nuance:
- Citi has set a year-end target for ETH around $4,300, citing growing interest in Ethereum-based applications (stablecoins, tokenized assets), but warning that sentiment may be overextended.
- Standard Chartered has revised its forecast upward to $7,500 by end of 2025, basing its view on increasing corporate involvement, expanding stablecoin market usage, and policy/regulatory tailwinds.
- Market data shows institutional accumulation below key support levels, plus “liquidation risk” for those shorting ETH: significant short-positions sit above resistance zones — if price rises, shorts could be squeezed.
- On the technical side, indicators (RSI, MACD) suggest cautious momentum: neither strong bullish nor completely bearish, but with warning signs if support is lost.
Practical Implications for Investors & Blockchain Practitioners
If you’re scanning for new crypto or assessing ETH as part of your portfolio / projects, here’s what to watch and what to do:
- Key levels as entry/exit points: $4,000 is a major line in the sand. A bounce from there with good confirmation may offer a lower-risk entry. On the flip side, a break below could signal a deeper correction; set stop-losses or reduce exposure accordingly.
- Monitor resistance breakouts: Watching ETH’s ability to get above $4,500 (especially 50-day EMA) could indicate a shift from correction mode into recovery. If that happens, upside toward $6,000-$7,000 becomes more actionable.
- Fundamental drivers: Keep an eye on ETF inflows, stablecoin/staking usage, and on‐chain activity (transactions, gas fees, L2 rollups). Also monitor upcoming upgrades (scalability, data availability enhancements) since these improve utility and network capacity.
- Macro / regulatory risk: Interest rates, global risk sentiment, regulation (especially in large jurisdictions) remain major sources of volatility. Even with strong technical or fundamental setups, adverse macro news can trigger steep downside.
- Alternative opportunities: Given Ethereum’s somewhat more established position, upside may be more limited compared to smaller cap or emergent crypto projects with real utility (Layer-2, rollups, tokenization, DeFi infrastructure). These may offer higher multipliers but come with greater risk.
Summary & Outlook
Ethereum is at a critical juncture. With its price under pressure, the $4,000 support zone is among the most consequential levels it must hold. If it does, a recovery toward $6,000–$7,000 becomes plausible, especially with institutional backing and protocol improvements. If not, ETH may retrace toward the $3,500 range or lower.
Analysts are divided: conservative forecasts hover around $4,300, while more bullish ones aim for $7,500 or beyond, assuming favorable macro and on-chain conditions. For those looking for new sources of crypto yield or projects, ETH remains a core asset but may have less explosive upside than earlier in the cycle — risk/reward may now favor selective allocation and exposure to smaller yet promising blockchain-based tokens.
