
Key Takeaways :
- Ethereum (ETH) has fallen to a monthly low near $2,780, placing a massive $540 million leveraged cluster around $2,700 under immediate threat.
- Spot Ethereum ETFs have recorded $533 million in net outflows over five consecutive trading days, signaling weakening institutional risk appetite.
- Derivatives data shows short positions dominating market structure, with over 82% of shorts concentrated near $2,700.
- A breakdown below this level could accelerate a cascade toward $2,500, while a successful defense may trigger a short squeeze back above $3,000.
- Despite bearish momentum, large-scale ETH accumulation by corporate treasuries suggests long-term conviction remains intact.
1. Ethereum’s Recent Price Decline: More Than a Technical Pullback
Ethereum’s recent slide to the $2,780–$2,800 range marks its lowest level of December and reflects more than routine volatility. The decline comes amid a notable contraction in spot trading activity, with daily volume falling approximately 14% to $28.9 billion, according to aggregated market data.
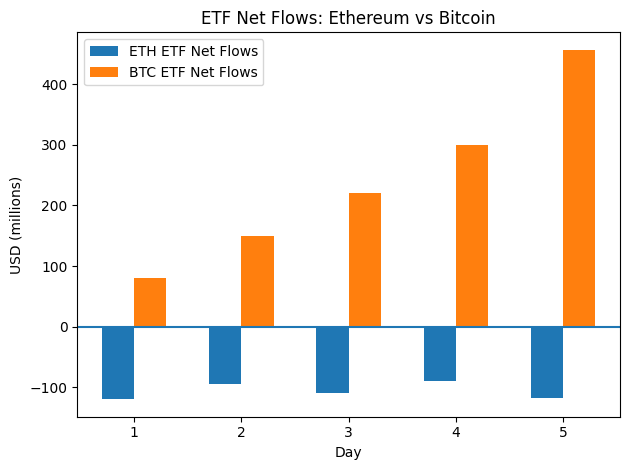
This price action coincides with a decisive shift in institutional behavior. Unlike Bitcoin, which recently absorbed $457 million in a single day of ETF inflows, Ethereum has experienced sustained capital withdrawal. The contrast underscores a growing divergence in how institutions currently perceive relative risk between BTC and ETH.
Importantly, this downturn has pushed ETH directly into a zone where leveraged positioning becomes the dominant driver of price, rather than organic spot demand.
2. ETF Outflows and Institutional Caution
Ethereum spot ETFs have now recorded five consecutive days of net outflows totaling $533 million. On December 17 alone, approximately $22.4 million exited ETH ETFs, with nearly $19.6 million attributed to BlackRock-managed products.
This behavior suggests institutions are unwilling to accumulate ETH aggressively within the $2,800–$3,000 range until macro or market clarity improves. Unlike early 2024, when ETF inflows acted as a stabilizing force, current flows are amplifying downside pressure.
What this signals:
Institutions are not exiting Ethereum entirely, but they are reducing exposure to leveraged downside risk and waiting for clearer confirmation of trend reversal.
Ethereum ETF Net Flows (5-Day Rolling Total, USD)
A bar chart showing cumulative ETF outflows for ETH versus inflows for BTC.
3. The $2,700 Leverage Cluster: Why This Level Matters
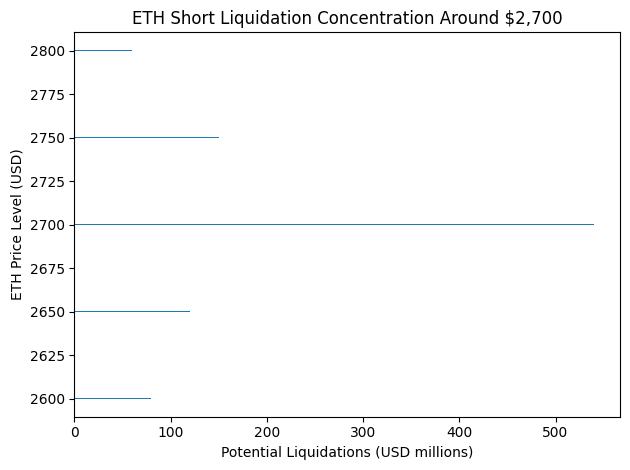
Data from derivatives analytics platforms shows an estimated $540 million worth of leveraged short positions clustered around $2,700. This zone accounts for roughly 82% of all active ETH short leverage, making it the most critical battleground in the current market structure.
If ETH breaks decisively below $2,700, forced liquidations could accelerate rapidly, pushing price toward the next high-liquidity zone near $2,500. Conversely, if bulls successfully defend this level, short sellers may be forced to cover, triggering a short squeeze.
This dynamic explains why relatively small spot movements near $2,700 could result in outsized volatility.
Ethereum Liquidation Heatmap Around $2,700
A horizontal heatmap illustrating concentrated short leverage below current price.
4. Derivatives Positioning: Bears Still in Control
Current derivatives metrics confirm bearish dominance:
- Open short interest: ~$1.78 billion
- Open long interest: ~$662 million
- MACD (4H & Daily): Below zero line, histogram expanding
- Funding rates: Neutral to slightly negative
These indicators suggest that while selling pressure is not accelerating dramatically, buyers lack conviction, and sellers retain momentum. The imbalance also explains why rebounds have been shallow and quickly sold into.
5. Technical Structure: Double Bottom or Breakdown?
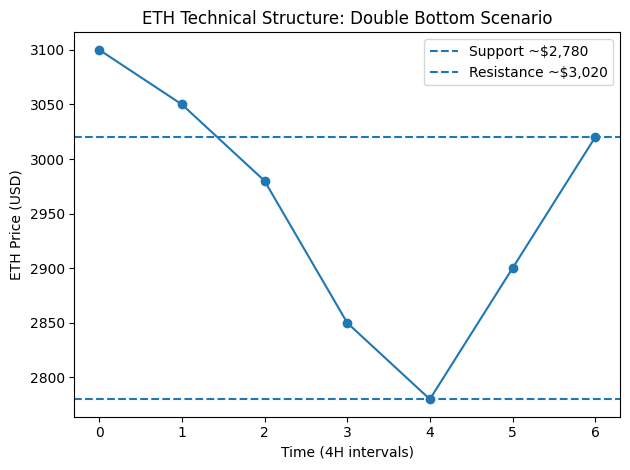
On the 4-hour chart, ETH appears to be forming a potential double bottom near $2,780, aligned with the lower Bollinger Band at approximately $2,779.63. Historically, this zone has served as a reversal point during oversold conditions.
Bullish Scenario
If ETH holds $2,780–$2,800:
- Initial rebound toward $2,900 (Bollinger midline)
- Extension to $3,020–$3,040 (double-bottom neckline)
- A confirmed break above $3,050 would validate a bullish reversal
Bearish Scenario
If ETH closes below $2,770 (daily):
- Liquidation-driven move toward $2,500
- Alignment with 58.9% Fibonacci extension
- Increased probability of capitulation selling
ETH 4H Technical Structure with Bollinger Bands and Key Levels
Annotated price chart highlighting $2,780 support and $3,020 resistance.
6. Long-Term Conviction vs Short-Term Fear
While derivatives traders position defensively, long-term accumulators are behaving differently. BitMine Immersion, one of the largest Ethereum-focused digital asset treasury companies, disclosed the purchase of 48,049 ETH (~$140.6 million) earlier this week, bringing total holdings to 3.97 million ETH, valued at approximately $11.6 billion.
Founder Tom Lee has repeatedly warned that betting on sustained downside in ETH has historically been a losing strategy, emphasizing that profitable long-term shorts are rare in structurally growing networks.
This divergence between short-term leverage-driven fear and long-term accumulation mirrors patterns seen in previous Ethereum cycle bottoms.
7. Practical Implications for Investors and Builders
For readers seeking new crypto assets, yield strategies, or practical blockchain applications, this moment highlights several lessons:
- Volatility creates opportunity, but leverage concentration magnifies risk
- Institutional flows matter more than narratives in the short term
- ETH’s role as settlement infrastructure continues to attract strategic capital
- Builders benefit from market drawdowns through lower deployment and acquisition costs
Rather than signaling Ethereum’s decline, the current stress may represent a redistribution phase from speculative leverage to stronger hands.
Conclusion: A Defining Moment for Ethereum
Ethereum stands at a pivotal crossroads. The $2,700 leverage cluster is not merely a technical level; it represents a collective psychological boundary between forced capitulation and renewed confidence.
If bulls defend this zone, the resulting short squeeze could rapidly restore ETH above $3,000, shifting sentiment decisively. If not, a temporary descent toward $2,500 may cleanse excess leverage and lay the groundwork for a healthier recovery.
In either scenario, Ethereum’s long-term fundamentals—developer activity, institutional treasury adoption, and real-world settlement use—remain intact. For those focused on practical blockchain utility and future income streams, periods like this often mark the beginning, not the end, of opportunity.
