
Key Points :
- Despite a sustained long-term uptrend, both the crypto market and Nasdaq are showing signs of short-term weakness.
- The majority of top cryptocurrencies and Nasdaq stocks are trading above their 200‑day SMAs, highlighting enduring bullish sentiment.
- Nearly half of the assets in both markets are trading below their 50‑day SMAs, signaling possible short-term downturn.
- Similar breadth patterns suggest a broad-based phenomenon—possibly linked to cautious positioning ahead of the Jackson Hole Fed symposium.
- Institutional adoption and rising correlation levels suggest crypto is increasingly integrated with traditional markets.
1. Long-Term Bullishness Endures
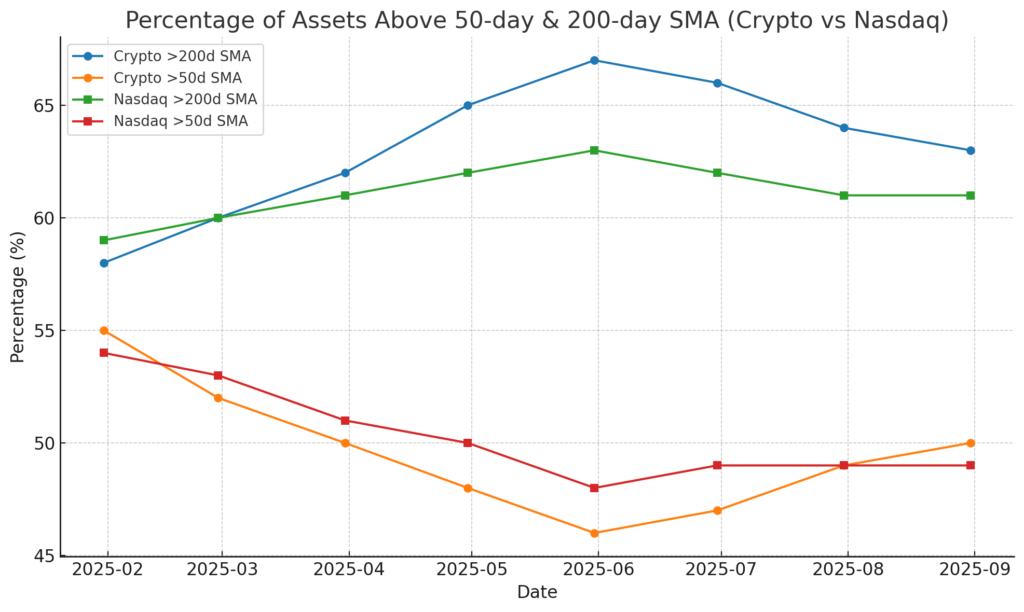
Market breadth analysis, which tracks the number of assets above or below key moving averages, shows that the long-term bullish trend remains intact in both crypto and technology sectors. Data from TradingView indicates that 63 of the top 100 cryptocurrencies (by market cap) are trading above their 200‑day simple moving average (SMA)—a trend also mirrored in the Nasdaq, where 61 of its stocks are above their respective 200‑day SMAs. This suggests strong underlying support from both retail and institutional investors who view the 200‑day SMA as a key trend indicator.
2. Short-Term Weakness Emerging
However, approximately half of the assets in both markets are trading below their 50‑day SMAs. This deviation implies a recent loss in momentum and raises the probability of a short-term downtrend. Traders often interpret prices below the 50‑day SMA as signs of weakening market confidence.
3. Sync in Breadth Patterns
That both crypto and Nasdaq show nearly identical breadth metrics underscores that this isn’t an isolated cryptomarket issue—but a broader technical phenomenon impacting both digital and traditional assets. One plausible driver is cautious repositioning by traders ahead of Fed Chair Jerome Powell’s speech at the Jackson Hole symposium.
4. Institutional Integration and Rising Correlation
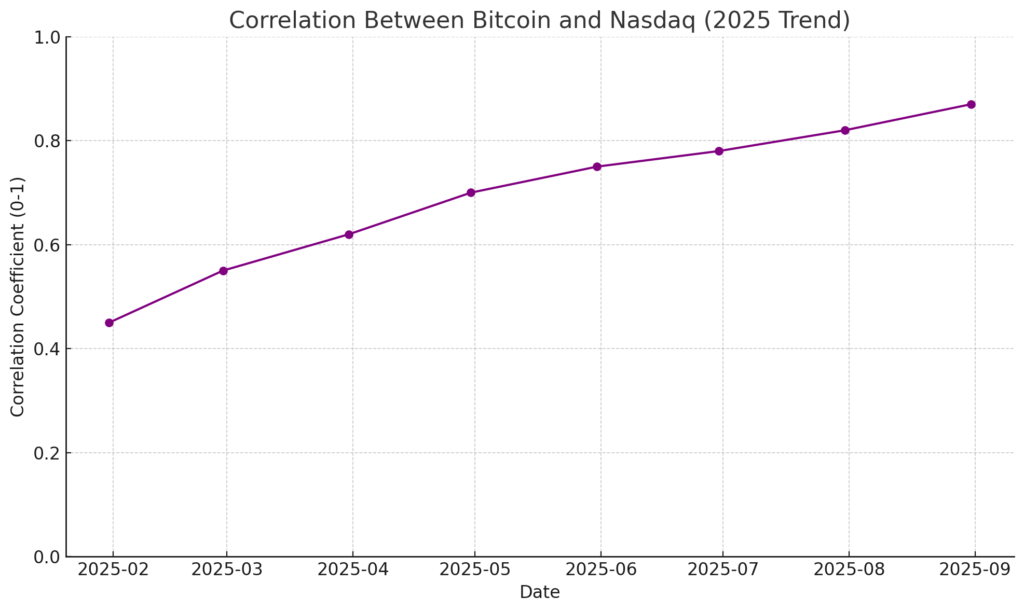
Beyond breadth, recent academic research points toward heightened correlation between Bitcoin and major U.S. equity indices. A study tracking data from 2018 to 2025 shows peak correlation levels reaching as high as 0.87, particularly during critical institutional adoption phases such as ETF launches and corporate treasury allocations. The implication: Bitcoin is increasingly behaving like a traditional financial instrument rather than a standalone alt-asset, with implications for how diversified portfolios should incorporate crypto.
5. What’s in Store: Market Context and Implications
Recent market sentiment is mixed. On one side, optimism remains strong: investors are encouraged by buoyant sentiment surveys and low interest rates. On the other, breadth in traditional equities is showing early signs of fatigue. For instance, some analysts warn that despite record index highs, weakening internals could signal looming corrections.
Conclusion
Long-term trends remain bullish in both crypto and Nasdaq, supported by most assets trading above their 200‑day SMAs—but near-term weakness is apparent, with around half under their 50‑day SMAs. The parallel breadth behavior suggests widespread caution across markets, potentially triggered by macro expectations and central bank anticipation. Simultaneously, rising institutional adoption and correlation dynamics indicate that cryptocurrencies, especially Bitcoin, are becoming more entangled with the broader financial ecosystem. For investors exploring new revenue streams or practical blockchain applications, these developments underscore the importance of monitoring trend internals and institutional signals—not just headline prices.
