Key Takeaways :
- Singapore and the UAE emerge as the top two nations most “crypto-obsessed” per ApeX Protocol, based on ownership, growth, search interest, and infrastructure.
- The U.S. ranks third in the ApeX index, driven by its vast crypto ATM network and infrastructure.
- In the broader Chainalysis 2025 Global Adoption Index, India leads globally, with the U.S. rising to second amid institutional flows and ETF activity.
- Stablecoins, tokenized real-world assets, and regulatory clarity are increasingly central to adoption dynamics.
- Emerging and frontier markets (e.g. Pakistan, Vietnam, Latin America) continue driving grassroots adoption, especially for remittance and utility use cases.
- Challenges remain: regulatory risk, security breaches, centralization pressures, and bridging retail interest with sustainable Web3 business models.
1. Background and ApeX Protocol’s “Crypto-Obsessed” Rankings
In a recent report by ApeX Protocol, Singapore and the United Arab Emirates (UAE) were ranked as the world’s most “crypto-obsessed” countries, based on a composite scoring of four metrics: ownership rate, adoption growth since 2019, search interest per capita, and crypto ATM availability.
- Singapore achieved a perfect score of 100, driven by 24.4 % of its population reportedly owning crypto and exceptionally high search activity (≈ 2,000 crypto-related queries per 100,000 people).
- Notably, Singapore’s ownership rate was only ≈ 11 % as recently as 2021, meaning the adoption has more than doubled in just a few years.
- Notably, Singapore’s ownership rate was only ≈ 11 % as recently as 2021, meaning the adoption has more than doubled in just a few years.
- The UAE scored 99.7, with a slightly higher ownership share (25.3 %) than Singapore, but slightly lower in search metrics or infrastructure.
- Its growth since 2019 is cited as +210 %.
- In 2022, observers note that over one-third of the UAE population reportedly held crypto.
The four metrics are intended to reflect both depth and breadth of interest and infrastructure: simply having many holders isn’t enough if growth is stagnant or access is poor.
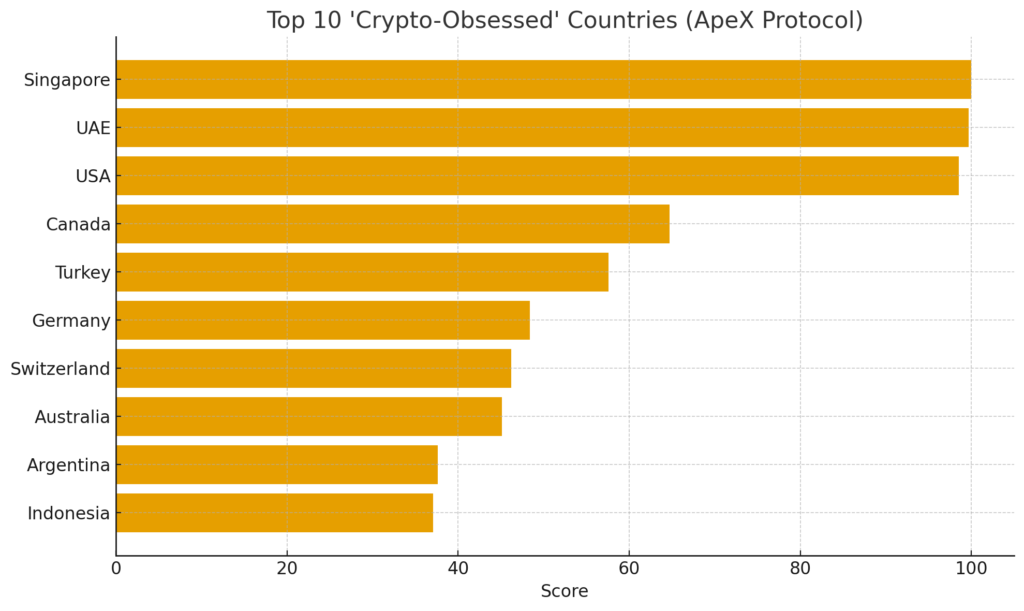
Following the top two, the United States ranked third in this ApeX index (score ≈ 98.5), powered heavily by its infrastructure, particularly over 30,000 crypto ATMs nationwide (far more than any other country) and robust growth in adoption since 2019 (+220 %).
Canada placed fourth, thanks to its extremely high adoption growth (225 % since 2019), with ~10.1 % of the population owning crypto and ~3,500 ATMs.
The fifth spot went to Turkey (score ~ 57.6) with ~19.3 % of its population holding crypto and strong search interest (~1,000 queries per 100,000)
Additional countries in the top 10 included Germany, Switzerland, Australia, Argentina, and Indonesia—each bringing their own mix of adoption momentum, infrastructure, and public engagement.
A spokesperson for ApeX says this ranking underscores that “crypto is no longer on the fringe” but becoming entwined with how nations define financial infrastructure, trust, and digital economies.
2. Chainalysis 2025 Global Adoption Index: India and U.S. Lead
While ApeX focuses on an “obsession” metric anchored in public interest and infrastructure, Chainalysis publishes a broader Global Crypto Adoption Index, which weighs on-chain and off-chain metrics of usage across centralized exchanges, decentralized finance (DeFi), institutional flows, and retail behavior.
In the 2025 edition of Chainalysis’s index:
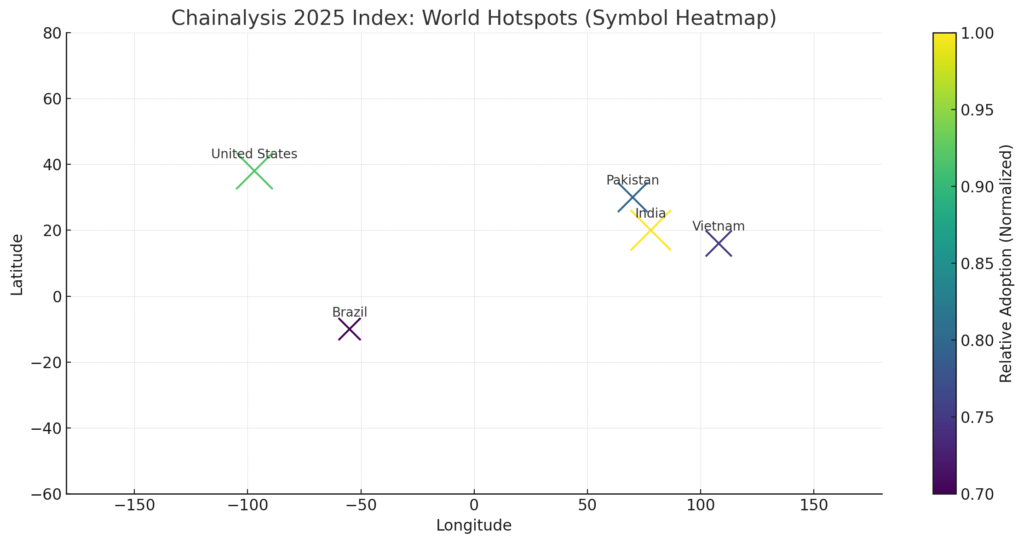
- India retains the #1 position, outperforming all other countries across every sub-index (centralized activity, DeFi, institutional, etc.).
- The United States jumped to #2, largely driven by rising institutional adoption and inflows into spot Bitcoin ETFs, combined with regulatory developments improving clarity.
- Other countries rising or maintaining positions near the top include Pakistan, Vietnam, and Brazil.
The Asia-Pacific region as a whole is highlighted as the fastest-growing in on-chain volume: from July 2024 to June 2025, APAC on-chain transaction volume grew ~ 69 %, reaching approximately $2.36 trillion (USD).
In North America, institutional activities and ETF flows have catalyzed growth. In particular, the U.S. has seen expansion in tokenized treasuries, bitcoin ETFs, and large institutional transfers.
For example:
- Total AUM in BTC ETFs globally has reportedly climbed to ~$179.5 billion (mid-2025), with the U.S. leading share.
- Tokenized money market funds (primarily based on U.S. treasuries) on-chain quadrupled in one year—from ~$2 billion to ~$7 billion.
- In centralized exchanges in the U.S., retail users bought ~$2.7 trillion of BTC, ~$1.5 trillion of ETH, and ~$0.45 trillion of USDT during the June 2024–July 2025 period.
Chainalysis posits that the confluence of better regulatory clarity, institutional adoption, and robust retail usage is driving the U.S.’s leap upward.
3. Why Singapore and UAE Outrank Others (Even Outside the Chainalysis Top)
One might ask: why do Singapore and UAE top the ApeX rankings when they don’t necessarily lead in raw volume metrics? The answer lies in per capita engagement, adoption momentum, and ease of infrastructure. These countries punch above their weight relative to their size.
3.1 Regulatory and Institutional Environment
- Singapore has taken a measured, business-friendly approach: its Monetary Authority of Singapore (MAS) has implemented licensing regimes for digital payment token services, consumer protection guidelines, and policy clarity that helps both retail and institutional participants feel safer.
- UAE has aggressively positioned itself as a crypto hub, especially Dubai and Abu Dhabi, using bodies like VARA (Virtual Assets Regulatory Authority) to balance innovation and oversight. Government-backed blockchain initiatives and a push for cross-border finance have reinforced adoption.
3.2 Public Interest and Visibility
- The extremely high per capita search interest in crypto in Singapore (≈ 2,000 per 100,000) indicates strong general awareness and curiosity.
- Since adoption ramped swiftly from ~11 % to ~24 % of population, the social momentum is visible.
3.3 Infrastructure, Access, and On-ramps
- Although Singapore and the UAE may not host as many ATMs as the U.S., their ecosystems are optimized for on-boarding: exchanges, wallets, regulation, licensing, and institutional presence help reduce friction.
- In contrast, the U.S. excels in sheer infrastructure (ATMs) but faces regulatory complexity and internal fragmentation.
Thus, Singapore and UAE’s leadership reflects a balance of depth, interest, and enabling environment rather than pure volume dominance.
4. Broader Trends in 2025: What’s Driving Adoption
To understand where the next opportunities lie, we must examine cross-cutting themes that are shaping crypto use beyond headline rankings.
4.1 Dominance of Stablecoins & On-Ramp Dynamics
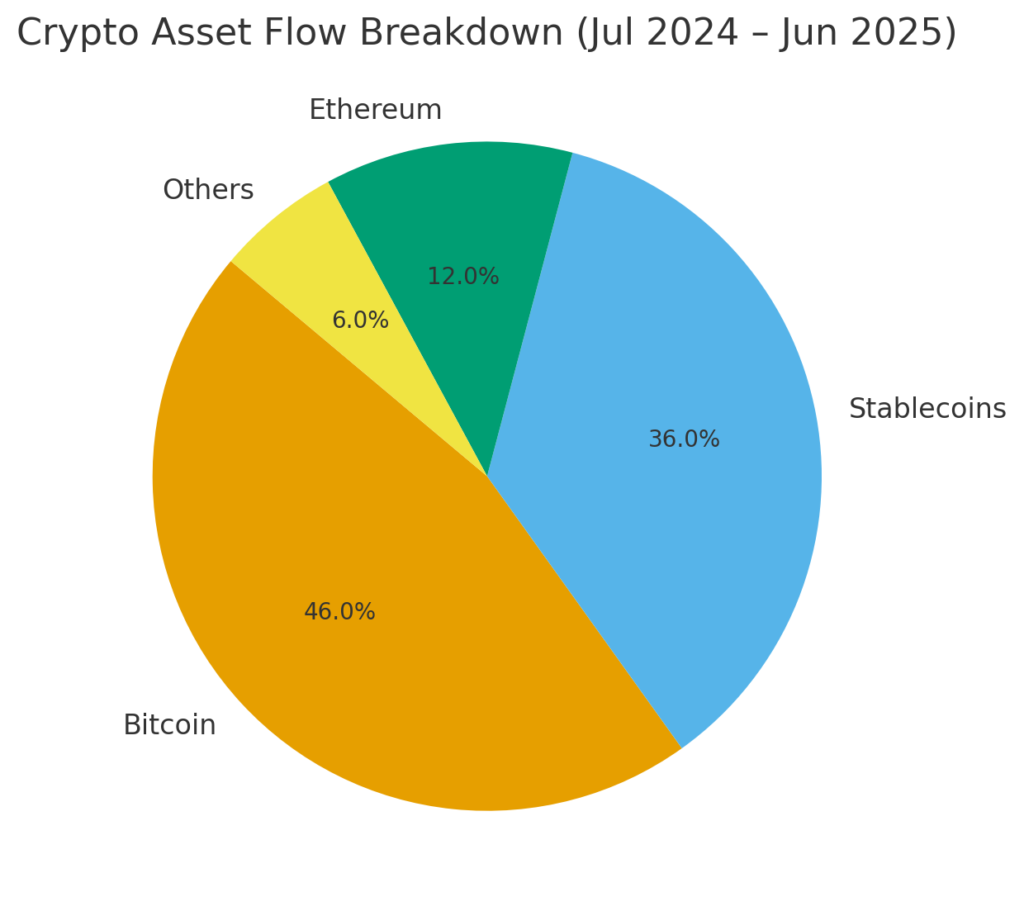
Stablecoins (especially USDT and USDC) continue to account for the lion’s share of global onchain flows.
Newer entrants such as EURC (from Circle) and PYUSD (by PayPal) are gaining increasing traction, particularly in regulated jurisdictions.
Bitcoin remains the primary fiat-to-crypto gateway, pulling in ~$4.6 trillion in flows in the period from July 2024 to June 2025—more than double any other crypto asset.
This concentration underlines how much crypto adoption still relies on bridging fiat rails and managing conversion risk.
4.2 Tokenized Real-World Assets (RWAs) and On-Chain Yield
Tokenization of traditional assets—especially money market funds, treasuries, bonds, and other fixed income instruments—is beginning to see traction.
- In the U.S., tokenized treasuries and money market funds grew rapidly year-over-year.
- These instruments provide relatively stable yield and can be composable in DeFi, lowering barriers for yield-seeking capital to engage on-chain.
4.3 Retail vs Institutional Balance & Volatility
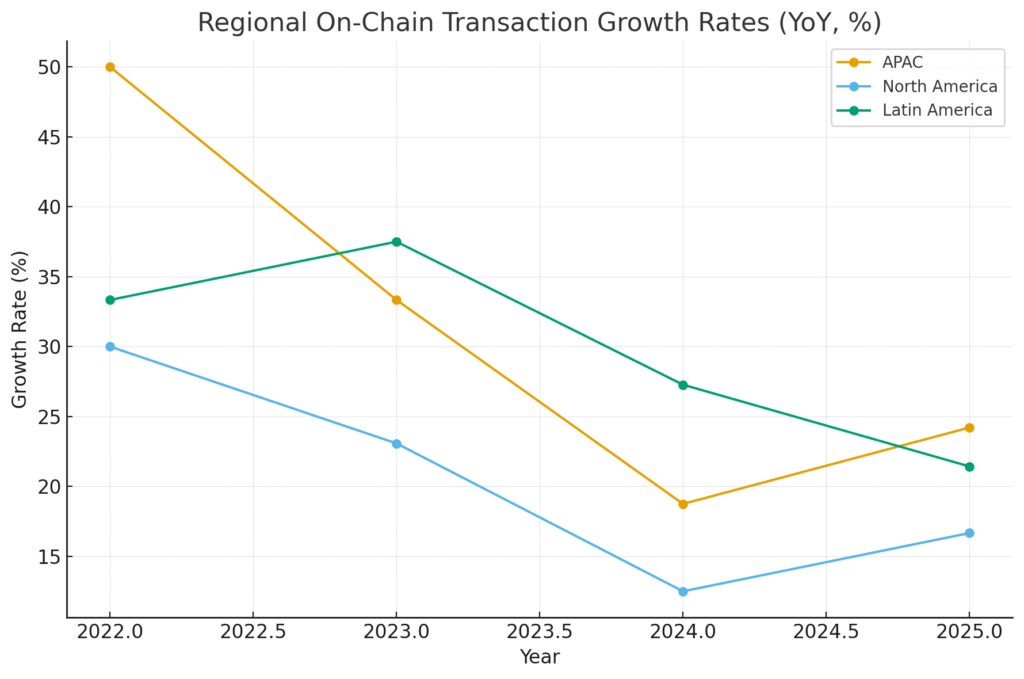
Regionally, North America is more volatile and more influenced by institutional flows; APAC, Latin America, and Sub-Saharan Africa show steadier patterns more anchored in retail and utility use cases.
Large transfers (>$10 million) continue to dominate value in North America, while smaller transfers matter more in emerging markets.
4.4 Cryptoeconomics, Decentralization, & Ecosystem Dynamics
A recent academic framework (Ju et al. 2025) analyzes whether crypto ecosystems are centralizing or decentralizing across layers (consensus, development, governance, applications). Their results suggest that while many networks have become more decentralized over time, recent pressures are pushing certain layers (e.g. developer concentration, NFT marketplaces) toward centralization.
For builders and adopters, this raises key questions:
- How do you maintain decentralization and trust while scaling?
- Which ecosystem models (modular, rollup-based, token-incentivized) will prevail?
- How to prevent gatekeeping by dominant infrastructure players?
4.5 Regulatory Clarity as a Growth Lever
Clear, permissive regulation is emerging as a key driver of adoption. The U.S. regulatory shift—pulling back guidance that hampered institutional participation—helped boost its rank.
Conversely, heavy-handed or uncertain regulation dampens innovation. India, for example, still leads despite regulatory ambiguity and tax burdens, but it has deliberately avoided overly aggressive integration into formal financial systems due to systemic risk concerns.
Thus, policy is not just a backdrop but a proactive lever for adoption.
4.6 Security, Trust, and Risk
As adoption grows, so do the risks. Crypto thefts and exchange hacks in 2025 have crossed $2.17 billion in just the first half of the year.
Major exchanges (like ByBit, CoinDCX) have been compromised, revealing critical vulnerabilities in custody, audit, and operational security.
For next-generation crypto ventures, security design, auditability, cross-chain safety, and user experience for safer custody remain non-negotiable foundations.
5. What This Means for Crypto Investors, Builders, and Strategists
Given the trends and country-level shifts, here are strategic implications and takeaways for your readers (those seeking new crypto assets, revenue sources, or real-world blockchain use cases):
5.1 Look Beyond Volume: Focus on Engagement & Growth
Top-ranking nations in volume are not always the most favorable markets for new entrants. Countries like Singapore and UAE show that high per-capita engagement, regulatory clarity, and infrastructure can create fertile ground for niche or emerging projects.
5.2 Target Stablecoin and RWA Infrastructure
Because stablecoins remain the backbone of fiat-to-crypto bridges, projects around stability, fiat-onramps, regulatory compliance, yield aggregation, or segmentation (local currency–backed stablecoins) remain high-leverage.
Similarly, tokenization of real-world assets is still nascent—but we’re seeing proof-of-concept traction in treasuries, money markets, real-estate-backed tokens, etc. Developers and protocol teams can gain early mover advantage here.
5.3 Regional Tailoring Is Vital
Markets like Pakistan, Vietnam, Latin America, and Sub-Saharan Africa are seeing real adoption for remittances, micro-payments, inflation hedging, and access to dollar networks. Products designed for those use cases may scale faster than speculative tokens.
5.4 Institutional & Regulatory Readiness
For projects to scale, alignment with institutional standards—auditability, compliance, KYC/AML, transparency—will increasingly matter. Building protocols that can be “institutionally friendly” without sacrificing decentralization will be a competitive edge.
5.5 Emphasize Security & Resilience
Given rising failure and exploit events, any project must invest up front in security, third-party audits, bug bounties, insurance, and recovery planning. Trust is harder to reclaim than win.
5.6 Monitor Ecosystem Decentralization Trends
The long-term health of crypto depends on resiliency and participation diversity. Monitor whether your protocol is vulnerable to central points of failure—whether in developer control, validator concentration, or data availability. Strive to design governance, incentives, and module separation to resist centralizing pressures.
6. (Suggested) Insertable Graphics / Figures
You might consider inserting the following figures to enhance readability and insight:
- Bar chart — Top 10 countries in the ApeX “crypto-obsessed” ranking (with scores). (Insert after section 1)
- World map heatmap — Highlighting top-performing countries in Chainalysis 2025 index (India, US, Pakistan, Vietnam, Brazil, etc.). (Insert in section 2)
- Line / growth chart — On-chain transaction volume growth by region (APAC vs North America vs LATAM) over recent years. (Insert in section 4)
- Pie / flow diagram — Breakdown of stablecoin vs Bitcoin vs other assets in flows or volume for July 2024–June 2025. (Insert in section 4)
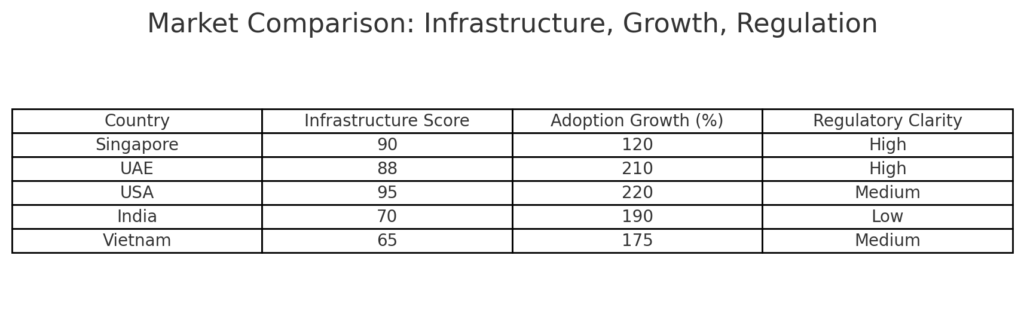
- Table — Contrast between infrastructure scores, adoption growth, and regulatory clarity for selected markets (Singapore, UAE, U.S., India, Vietnam). (Insert before section 5)
You will need to collect the raw data or visually design those, but these visuals will help your readers digest and compare trends at a glance.
7. Summary & Final Thoughts
In 2025, crypto adoption is increasingly defined not just by raw transaction volumes, but by balanced ecosystems—those that combine public interest, accessible infrastructure, regulatory clarity, and sustainable protocols.
- The ApeX ranking spotlights that Singapore and UAE lead in “crypto obsession” when weighted by per-capita engagement, growth, ownership, and access.
- Meanwhile, Chainalysis shows India remains the global leader in adoption volume and core usage, with the U.S. climbing thanks to institutional momentum and ETF inflows.
- The backbone remains stablecoins and gateway assets, while tokenized real-world assets and yield infrastructure are rising as next frontiers.
- For builders and investors, the key is bridging the gap between retail demand and scaled, secure, compliant infrastructure. Projects that align with real-world financial systems, offer robust security, and support modular decentralization will be better positioned for the long-term.
As adoption accelerates globally—led by regions both developed and emerging—this is a period of opportunity for new protocols, cross-border utility platforms, compliance-forward DeFi tools, and tokenized finance pipelines. The next wave will reward those who can build durable, trust-centric, and scalable bridges between Web3 and real-world capital.
