Main Points :
- Bitcoin’s weekly RSI has dropped to 26.84, the third most oversold level in history.
- Crypto research firm K33 warns that following the crowd could be a mistake during this downturn.
- Bitcoin has experienced six consecutive weeks of decline and five consecutive monthly losses, an unusual pattern.
- The derivatives market shows extreme bearish positioning, including negative funding rates and declining CME futures open interest.
- Despite negative sentiment, spot Bitcoin ETFs recorded inflows of more than 20,000 BTC in a week, the largest in five months.
- Institutional flows and structural market changes suggest long-term upside potential remains intact.
1. Extreme Oversold Conditions in Bitcoin
Bitcoin has entered one of the most pessimistic phases in its modern market history. According to a March 4 report from crypto research firm K33, the flagship cryptocurrency’s weekly Relative Strength Index (RSI) fell to 26.84, marking the third most oversold reading ever recorded for Bitcoin on a weekly timeframe.
This technical indicator is widely used by traders to evaluate whether an asset has been overbought or oversold. In traditional financial markets as well as crypto markets, an RSI below 30 is typically considered oversold territory. However, reaching such an extreme level on a weekly chart—which represents longer-term market momentum—is exceptionally rare.
The current environment is made even more remarkable by Bitcoin’s six consecutive weekly declines combined with five straight months of losses. Historically, Bitcoin has rarely experienced such a prolonged stretch of negative price action. These types of multi-month downturns tend to occur only during major macro shocks or during the late stages of previous crypto bear markets.
Yet K33’s Head of Research, Vetle Lunde, argues that such moments often present the strongest contrarian opportunities.
He summarized the situation with a blunt warning:
“If you follow the crowd, you will likely be wrong.”
This statement reflects a long-standing principle in financial markets: the most profitable trades are often made when sentiment is extremely negative but fundamentals remain intact.
(“Bitcoin Weekly RSI Historical Comparison”)
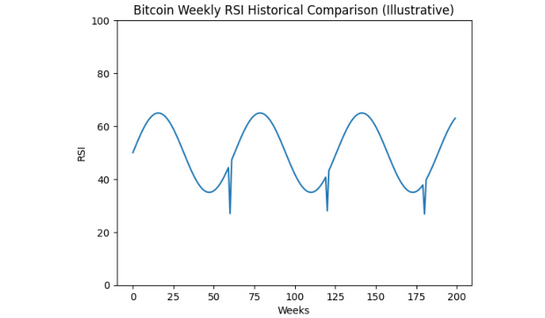
A line chart comparing Bitcoin’s weekly RSI over time, highlighting the three lowest readings in history (including the current 26.84 level).
2. Derivatives Markets Signal Extreme Bearish Sentiment
The pessimism is not limited to spot market traders. Derivatives markets—often considered the most sophisticated segment of the crypto ecosystem—are also displaying unusually bearish positioning.
K33’s research highlighted several key signals:
- Perpetual futures funding rates turned negative on a 30-day average basis for the 10th time since 2018.
- CME Bitcoin futures open interest declined by roughly 35%, reflecting institutional deleveraging.
- Approximately 90,000 BTC flowed out of spot ETFs over five months, suggesting institutional caution during the recent correction.
Negative funding rates in perpetual futures indicate that short sellers are dominant and must pay funding fees to long positions. When this persists for extended periods, it often reflects extreme pessimism among leveraged traders.
Historically, such conditions frequently precede short squeezes or sharp reversals, because markets become crowded with bearish positions.
Institutional derivatives activity also reveals declining risk appetite. The Chicago Mercantile Exchange (CME), a key venue for institutional Bitcoin trading, saw its futures open interest drop significantly during the downturn.
However, this reduction may not necessarily signal long-term institutional exit. Instead, it often reflects temporary deleveraging during volatile macroeconomic environments.
3. Macroeconomic and Geopolitical Pressures
The broader macro environment has played a significant role in shaping crypto market sentiment.
Bitcoin has declined more than 40% from its October 2025 all-time high and remains roughly 22% lower year-to-date. Several external factors have contributed to this decline:
- Rising geopolitical tensions in the Middle East
- A U.S.-Israel military strike against Iran
- Increased volatility across global risk assets
- Monetary policy uncertainty in major economies
Geopolitical shocks tend to trigger short-term risk-off behavior in financial markets. Investors temporarily move away from volatile assets—including cryptocurrencies—and shift toward traditional safe-haven assets such as government bonds or gold.
Interestingly, however, the data suggests that Bitcoin may be gradually evolving into a hybrid asset that behaves partly like a risk asset and partly like a macro hedge.
During the latest escalation in Middle East tensions, Bitcoin managed to hold near $68,000, demonstrating relative resilience compared with previous geopolitical crises.
(“Bitcoin Price vs. Gold During Geopolitical Stress”)
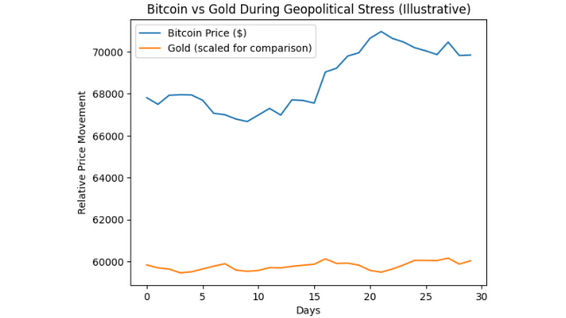
A comparative chart showing Bitcoin and gold performance during the recent geopolitical tensions, highlighting Bitcoin’s relative stability around $68,000.
4. Institutional Demand Begins to Return
Despite months of bearish sentiment, recent data suggests that institutional investors may already be returning to the market.
Over the past week alone, spot Bitcoin ETFs recorded net inflows exceeding 20,000 BTC, the strongest weekly inflow in five months.
This reversal in flows is significant for several reasons.
First, spot Bitcoin ETFs represent one of the primary channels through which traditional finance accesses cryptocurrency exposure. Large inflows into these products often indicate renewed institutional confidence.
Second, ETF flows are widely considered a structural demand driver for Bitcoin. Unlike speculative derivatives trading, ETF purchases typically represent longer-term investment allocations rather than short-term leverage.
At the same time, Bitcoin briefly surged to $74,000, representing a 7.7% daily gain. In contrast, gold—a traditional safe haven—rose only 0.92% on the same day.
This divergence highlights Bitcoin’s unique market positioning: it can behave both as a risk asset during bullish cycles and as a store-of-value alternative during periods of monetary uncertainty.
(“Spot Bitcoin ETF Net Flows (Monthly)”)
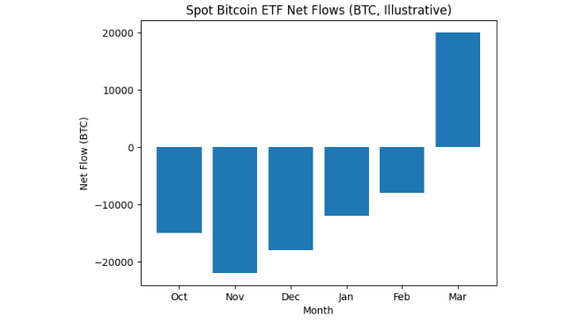
Bar chart showing monthly inflows and outflows for spot Bitcoin ETFs, highlighting the recent 20,000 BTC weekly inflow.
5. Structural Changes in Bitcoin’s Market Cycle
Another important perspective comes from Jan van Eck, CEO of global asset manager VanEck.
In a recent interview, Van Eck suggested that the current market environment resembles a mid-cycle correction within Bitcoin’s traditional four-year cycle rather than the start of a prolonged bear market.
Historically, Bitcoin has followed a pattern influenced by its halving cycle, which reduces the supply of new coins approximately every four years.
These cycles typically follow a structure:
- Accumulation phase after a bear market
- Bull market expansion following a halving
- Mid-cycle correction during macro stress
- Final euphoric rally before the next bear phase
Van Eck argues that the emergence of spot ETFs and institutional capital may fundamentally reshape this cycle.
Unlike previous cycles dominated by retail speculation, today’s Bitcoin market includes:
- Asset managers
- pension funds
- hedge funds
- sovereign wealth funds
These participants introduce long-term capital flows that could stabilize Bitcoin’s price dynamics.
6. Why the Risk-Reward Balance May Favor Upside
After analyzing the current market structure, K33 concludes that the risk-reward profile for Bitcoin has shifted asymmetrically to the upside.
In other words, the probability of meaningful upside may now outweigh the risk of further downside.
Several factors support this thesis:
- Extremely oversold technical conditions
- Bearish derivatives positioning that could unwind rapidly
- Renewed ETF inflows from institutional investors
- Increasing global interest in Bitcoin as a macro asset
- The approaching late phase of the current halving cycle
For long-term investors and crypto entrepreneurs, this type of environment historically marks the transition from fear to opportunity.
The key variables to monitor going forward include:
- Sustained inflows into Bitcoin ETFs
- Bitcoin’s ability to hold the $70,000 support level
- macroeconomic stability and geopolitical developments
If institutional demand continues strengthening, Bitcoin could potentially enter the next phase of its market cycle sooner than many traders expect.
Conclusion: When the Crowd Turns Bearish, Opportunity Emerges
The current Bitcoin market environment is defined by deep pessimism, heavy derivatives shorts, and lingering macro uncertainty. Yet these same conditions may be laying the foundation for the next major opportunity.
K33’s warning that “following the crowd could be wrong” reflects a critical insight: markets often reach their most profitable entry points when sentiment becomes overwhelmingly negative.
At the same time, structural shifts—such as the rise of spot Bitcoin ETFs and increasing institutional participation—are transforming Bitcoin from a speculative niche asset into a core component of the global financial system.
For investors searching for the next generation of crypto opportunities, the lesson is clear: moments of maximum fear often coincide with the beginning of the next growth cycle.
If Bitcoin can maintain support around $70,000 while ETF inflows continue to rise, the current correction may ultimately be remembered not as the start of a downturn—but as the reset that fueled the next phase of adoption and price expansion.
