Main Points:
- A technical bullish pattern known as “Three‐Role Bullish Signal” (literally “three roles reversing to positive”) has formed in BTC’s USD price chart, reinforcing momentum.
- The U.S. Federal Reserve’s recent policy meeting (FOMC) delivered a first rate cut in nine months and signaled possible further cuts, though hawkish language suggests gradualism.
- On‐chain metrics show institutional accumulation (lower exchange inflows, strong smart money signals) and easing supply pressure.
- Key resistance lies at around $120,000, which, if cleared, could open the way toward full retracement of prior highs. Failure to hold support or break resistance may lead to pullbacks.
- Macro risks remain: U.S. dollar strength, bond yields, policy shifts, and potential profit taking.
1. What is “The Three Roles Turned Around” and its Significance
“Three‐Role Bullish Signal” is a Japanese technical analysis term, derived from Ichimoku Kinko Hyo (One-Look Equilibrium Chart) methodology. It refers to three favorable developments:
- The Tenkan-Sen / Kijun-Sen crossover (conversion line above base line),
- The Chikou Span (lagging span) being above the past price, and
- The price breaking above the Ichimoku cloud (Kumo).
When all three are aligned, this signals a strong bullish trend in many Ichimoku users’ views. In the recent bitbank analysis, BTC/USD completed this “The Three Roles Turned Around”, reinforcing technical sentiment toward higher prices. (From the bitbank article.)
2. FOMC and Rate Cut Impacts
The FOMC meeting delivered a rate cut for the first time in nine months. According to bitbank’s report:
- After this rate cut, dot plot forecasts showed potential for two more rate cuts this year.
- Fed Chair Powell warned that cuts won’t be rushed; inflation and employment risks remain.
- Still, markets responded positively: declining yields and expectations of easing monetary tightening have served as tailwinds.
Combined with the technical pattern, this macro backdrop supports a scenario where Bitcoin could test higher levels.
3. On-Chain and Market Structure Signals
Recent data from Bitbank’s own report and other sources show multiple supportive signals:
- BTC trading in USD had stopped falling around the $115,865 level (mid point between the August all-time high and September low), which acted as support.
- Exchange inflows are at low levels, meaning fewer coins being moved in for sale. Institutional accumulation appears strong: the Smart Money Index (SMI) is at a multi-week high in many sources.
- Spot Bitcoin ETFs are seeing inflows. Retail interest is present but institutional flows are becoming more prominent.
4. The $120,000 Resistance Level – Why It Matters
A recurring theme across recent reports is the psychological and technical resistance around $120,000. Some key observations:
- Many analysis pieces point out that BTC is trading in a tight zone between ~$117,000–$118,000. To move toward $120,000, BTC must break through this resistance and hold it as support.
- Option markets show high open interest at the $120,000 strike price, making it a key resistance cluster.
- If resistance gives way, further upside targets in some forecasts go toward $122,000-$130,000. Conversely, failure may lead to retracements to prior support zones (e.g. near $115,000).
5. Risks, Caveats, and What Could Go Wrong
Even with strong signals, there are multiple risks to monitor:
- Profit taking around new highs could lead to pullbacks. If traders begin to distribute, price may retreat to support levels.
- Macro risks: U.S. inflation data, economic growth surprises, or Fed changing tone could reverse current expectations. USD strength / bond yields rising could also weigh.
- Overbought conditions on technical indicators (RSI, MACD) could cause consolidation or correction. Some reports note overbought signals already.
6. Recent Movement and Trend Confirmation (Aug-Sep 2025)
Putting the bitbank analysis in context with other recent data:
- BTC has rallied through several resistance zones and made new all‐time highs in USD near $118,000 – $120,000.
- Institutional flows (e.g. via spot ETFs) have accelerated. Some large ETFs hold hundreds of thousands of BTC.
- On-chain metrics such as exchange inflows, smart money activity, and accumulation by long-term holders support less selling pressure.
Chart/Image Suggestion
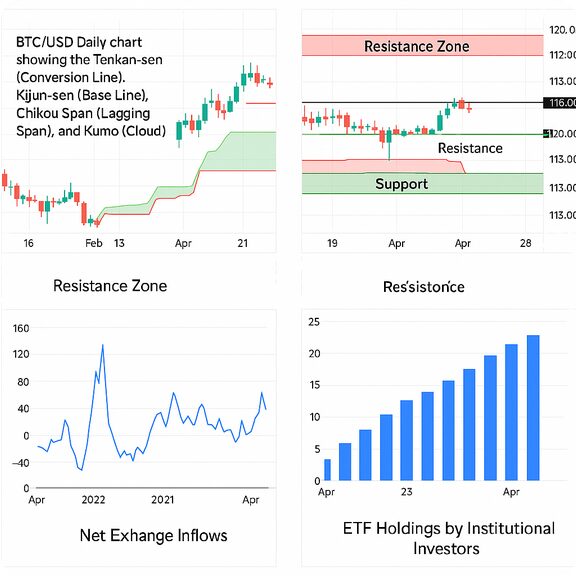
- A daily BTC/USD chart showing the Ichimoku components: Tenkan, Kijun, Chikou Span, and cloud, to illustrate where “三役好転” completes.
- A second chart with resistance and support zones marked: current price, $117,000–$118,000 resistance band, $120,000 resistance, supports at $115,000 etc.
- On-chain indicators: a line chart of exchange inflows over time; institutional ETF holdings over time.
7. What This Means for New Crypto Assets and Practical Blockchain Use
For those looking beyond Bitcoin (or using this trend):
- Bitcoin strength tends to draw capital out of lesser assets, but also creates opportunity: altcoins might benefit from rotation if BTC pauses or consolidates after reaching new highs. Keep an eye on ETH, SOL, or assets with strong fundamentals or real-use cases.
- Infrastructure plays: ETF providers, custody services, and platforms that facilitate institutional access will likely see increased demand.
- For projects in blockchain fields (DeFi, Oracles, Scaling solutions), a rising BTC price tends to expand interest in the broader crypto ecosystem, which may help funding, usage, and visibility.
Conclusion
Bitcoin has recently exhibited a convergence of favorable signals: a completed 三役好転 technical pattern, easing monetary policy expectations from the Fed, strong institutional accumulation, and support at key on-chain metrics. The resistance around $120,000 looms large—not a guarantee of breakthrough, but a critical level: if BTC can convincingly clear it and hold above it, further upside toward the full retracement of prior highs becomes far more plausible. However, risks of profit‐taking, macro shifts, or overbought technicals could induce pullbacks, especially if support zones around $115,000 fail.
For crypto investors hunting new assets or seeking next yield sources, the current environment looks favorable for Bitcoin dominance, but also possibly setting up a base for altcoin rotation and for infrastructure / utility blockchain projects to leverage the capital inflows. Stay alert to both macro policy signals and on-chain metrics—they continue to offer leading indicators in this phase.
