Main Points :
- Bitcoin’s 14-day Relative Strength Index (RSI) has fallen below 30 for only the third time in history.
- Previous occurrences in 2015 and 2018 preceded extended consolidation phases before major breakouts.
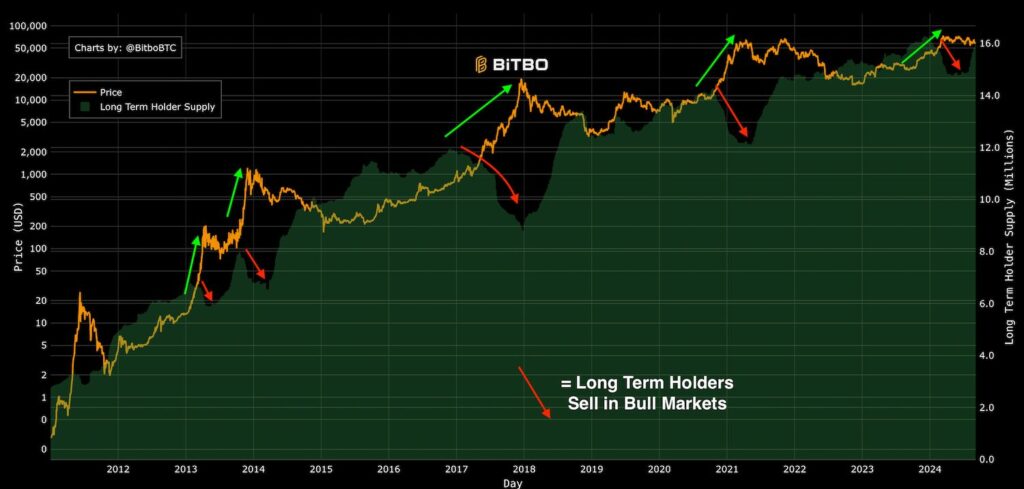
- On-chain metrics suggest long-term holders continue accumulating despite short-term weakness.
- Institutional participation remains structurally stronger than in previous cycles.
- Macro conditions and ETF flows are shaping a new type of Bitcoin cycle.
- Strategic positioning during prolonged sideways markets historically delivers superior risk-adjusted returns.
1. A Rare Technical Event: Bitcoin’s RSI Drops Below 30 for the Third Time
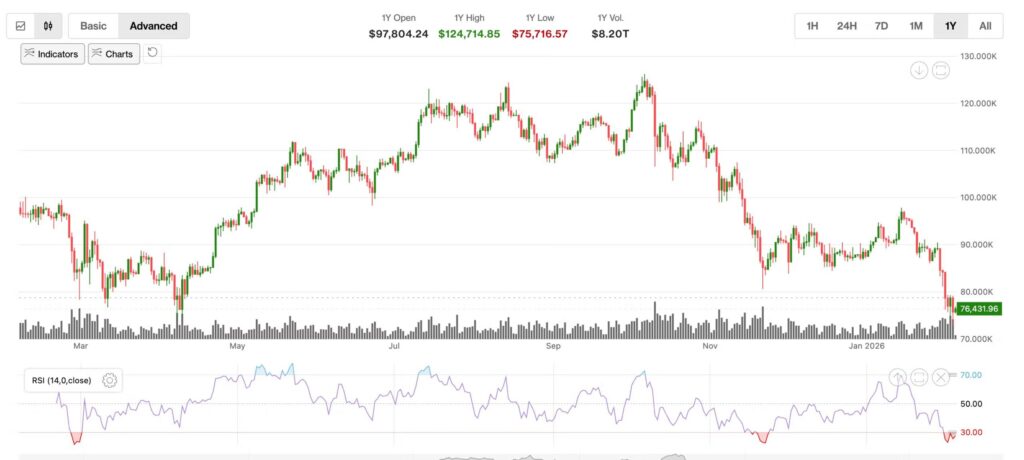
According to market data highlighted by CoinDesk and analytics provider checkonchain, Bitcoin’s 14-day Relative Strength Index (RSI) has fallen below 30 — marking only the third time in its history that such an event has occurred.
The RSI is a momentum oscillator developed by J. Welles Wilder. It measures the magnitude and speed of price movements by comparing average gains to average losses over a set period, typically 14 days. A reading below 30 is traditionally considered “oversold,” suggesting intense selling pressure.
Historically, Bitcoin has only entered this territory twice before:
- During the 2015 post-Mt. Gox capitulation period
- During the 2018 bear market bottom following the ICO bubble collapse
In both cases, the RSI breakdown did not immediately trigger a vertical rebound. Instead, Bitcoin entered a prolonged consolidation phase lasting several months before eventually breaking out into a new macro bull cycle.
Today’s event therefore carries structural implications beyond short-term volatility.
2. Lessons from 2015 and 2018: Sideways Before Surge
When Bitcoin’s RSI collapsed in early 2015, the market had already endured more than a year of decline. What followed was not an explosive recovery but a slow accumulation phase between roughly $200 and $300 before the 2016–2017 bull run began.
Similarly, in late 2018, after Bitcoin crashed from nearly $20,000 to below $3,500, RSI reached deeply oversold territory. Yet instead of an immediate reversal, Bitcoin traded sideways between approximately $3,500 and $4,200 for several months.
The common pattern was clear:
- Capitulation
- Volatility compression
- Long consolidation
- Structural breakout
The RSI drop historically marks the transition from panic to rebuilding — not from bottom to instant moonshot.
For investors seeking asymmetric returns, the consolidation phase has often offered superior entry opportunities compared to chasing breakouts.
3. The Current Cycle: What Makes 2026 Different?
While technical signals resemble past cycles, the macro backdrop is fundamentally different.
Institutional Participation
Since the approval of spot Bitcoin ETFs in the United States, institutional access has deepened significantly. Asset managers, pension funds, and sovereign capital now participate through regulated vehicles.
This creates two opposing forces:
- Structural demand from ETF inflows
- Short-term volatility from macro risk-off conditions
Unlike 2015 or 2018, today’s Bitcoin market is intertwined with global liquidity cycles.
Macro Environment
Interest rate policy, U.S. dollar strength, and global risk sentiment continue to influence crypto markets. When real yields rise, speculative assets face pressure. However, Bitcoin’s correlation with traditional risk assets has weakened relative to 2022–2023 levels.
This suggests Bitcoin may be transitioning from a purely speculative asset toward a hybrid macro-digital asset class.
4. On-Chain Metrics: Accumulation Under the Surface
Despite the RSI weakness, on-chain indicators show constructive signs:
- Exchange reserves continue trending downward.
- Long-term holder supply remains near cycle highs.
- Realized price bands suggest the market trades near cost basis for many participants.
- Accumulation addresses have expanded steadily.
Historically, deep RSI readings coincide with long-term holder dominance increasing. Strong hands absorb supply from weak hands.
This phase tends to look boring — until it is not.
5. Consolidation as an Opportunity, Not a Threat
For readers focused on discovering new digital asset opportunities and revenue strategies, consolidation periods present unique advantages:
Lower Volatility Environment
Reduced volatility allows structured strategies such as:
- Delta-neutral yield farming
- Options premium harvesting
- Systematic accumulation programs
- Bitcoin-backed lending structures
Rotation Into High-Conviction Altcoins
During sideways Bitcoin phases, capital often rotates into emerging sectors such as:
- Real-world asset tokenization (RWA)
- Layer-2 scalability solutions
- AI-integrated blockchain protocols
- DePIN (Decentralized Physical Infrastructure Networks)
Investors who maintain liquidity during consolidation are better positioned to allocate selectively rather than reactively.
6. Technical Structure: Compression Before Expansion
Bitcoin currently trades within a compressed volatility band. Historically, volatility compression leads to explosive expansion.
Technical analysts often observe:
- Declining Bollinger Band width
- Falling Average True Range (ATR)
- Range-bound price channels
Compression is the coiling of a spring. The longer the compression persists, the stronger the eventual expansion.
The key variable is direction — and direction is often determined by liquidity.
7. Risk Considerations
A third historical RSI breakdown does not guarantee a bottom.
Risks include:
- Further macro tightening
- ETF outflow cycles
- Regulatory surprises
- Geopolitical risk events
However, historically, RSI <30 events have not occurred near cycle tops. They have occurred during deep corrective phases.
Risk-reward asymmetry improves as panic increases — provided capital allocation is disciplined.
8. Strategic Framework for Long-Term Participants
Rather than predicting exact price levels, strategic participants may consider:
- Gradual dollar-cost averaging near realized price bands
- Allocating only risk capital
- Combining spot exposure with yield strategies
- Maintaining liquidity for breakout confirmation
Patience has historically been rewarded more than emotional reaction.
9. Conclusion: From Capitulation to Construction
Bitcoin’s third historical RSI breakdown is less a signal of collapse and more a signal of transition.
In both 2015 and 2018, similar conditions preceded extended sideways markets that quietly built the foundation for the next bull cycle.
If history rhymes rather than repeats, the current environment may represent:
- The exhaustion of sellers
- The strengthening of long-term holders
- The compression of volatility
- The preparation for structural expansion
For investors seeking new crypto assets, revenue opportunities, and practical blockchain applications, the consolidation phase is not dead time — it is building time.
The market rarely announces the beginning of the next cycle loudly. It usually whispers first.
And right now, the whisper is technical, structural, and historically rare.
