Main Points :
- Bitcoin’s recent price rebound is occurring within a confirmed bear market, not necessarily signaling a new bull cycle.
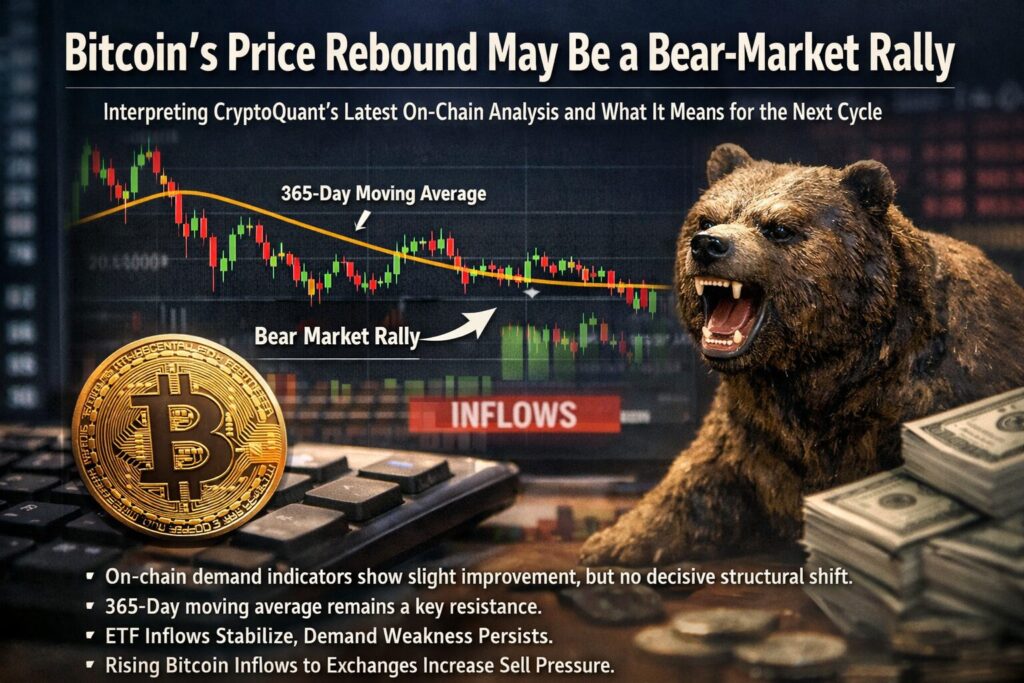
- On-chain demand indicators show slight improvement, but no decisive structural shift.
- The 365-day moving average remains a critical long-term threshold that historically caps bear-market rallies.
- U.S. spot ETF inflows have stabilized, yet they are not strong enough to offset broader demand weakness.
- Rising Bitcoin inflows to exchanges suggest increasing sell-side pressure in the near term.
Introduction: A Familiar Pattern in a New Market Phase
Bitcoin has once again staged a notable rebound, sparking renewed debate over whether the market has already bottomed or whether this recovery is merely a pause in a broader downtrend. According to a recent weekly report by CryptoQuant, the answer leans toward caution.
While price action since late November has been impressive—recovering more than 20% from local lows—the broader structural indicators suggest that Bitcoin remains in a bear market regime. This distinction is crucial, especially for investors and builders who are searching not only for price appreciation but for sustainable revenue opportunities and practical blockchain use cases.
This article summarizes CryptoQuant’s findings in depth, contextualizes them with historical market behavior, and adds broader industry perspectives to help readers understand what may lie ahead.
Confirmed Bear Market: The Role of the 365-Day Moving Average
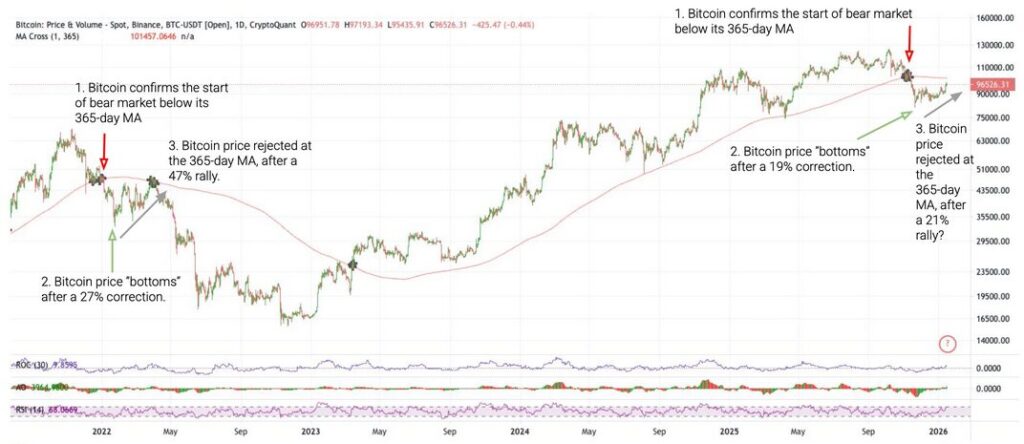
A key signal emphasized in CryptoQuant’s analysis is Bitcoin’s interaction with the 365-day moving average (365D MA). This indicator represents the average price over the past year and is widely used to identify long-term trend regimes.
Bitcoin decisively fell below this level, declining approximately 19%, which historically marks the formal entry into a bear market. Although price has since rebounded by roughly 21%, this recovery alone does not invalidate the bearish classification.
Why the 365D MA Matters
Historically, Bitcoin bear markets often feature sharp rebounds that approach—or briefly test—the 365-day moving average. However, these rallies frequently fail, leading to renewed downward pressure.
In previous cycles, including 2022, Bitcoin encountered resistance almost immediately after reclaiming or nearing this level. The result was not a renewed bull run, but a continuation of the bear market decline. CryptoQuant notes that current price behavior shows worrying similarities to those past patterns.
Current Price Levels: Echoes of Past Bear-Market Rallies
At the time CryptoQuant published its analysis, Bitcoin was trading near $101,000, a level close to historical resistance zones observed in previous downturns. Subsequent market movement has seen Bitcoin drift closer to $95,000, reinforcing the idea that the rebound may be losing momentum.
In prior bear markets, rallies that stalled near comparable thresholds were often followed by deeper retracements. While history never repeats perfectly, on-chain data suggests that the probability of a similar outcome remains non-trivial.
Market Psychology: The Return of “Cycle Is Dead” Narratives
One of the most striking parallels CryptoQuant draws is not technical, but psychological. During the 2022 bear market, many participants declared that Bitcoin’s traditional four-year cycle was obsolete. Narratives such as “supercycles” and permanently altered market structures dominated discourse.
CryptoQuant argues that today’s sentiment is not fundamentally different. Optimism driven by ETFs, institutional participation, and macro narratives may be overshadowing persistent weaknesses in both fundamental and technical indicators.
In other words, belief alone is once again running ahead of data.
Demand Conditions: Stabilization Without Expansion
Demand-side metrics show a mixed picture. According to CryptoQuant, Bitcoin demand has not deteriorated dramatically, but neither has it shown meaningful growth.
Spot Market Signals
U.S.-based spot indicators, including the Coinbase price premium, briefly turned positive in early 2026. However, this positive period was short-lived and insufficient to establish a durable trend.
Over the past 30 days, net spot demand has declined by approximately 67,000 BTC, remaining negative since late November 2025. This suggests that organic buying pressure from spot markets is still weak.
Bitcoin Spot ETFs: A Floor, Not a Catalyst
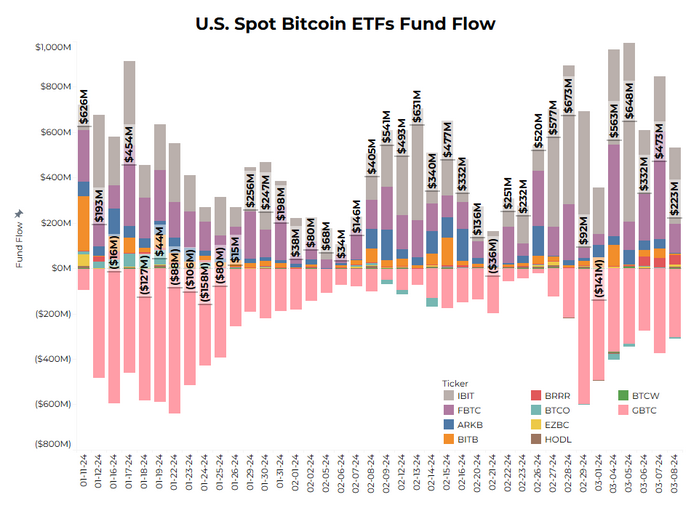
U.S.-listed Bitcoin spot ETFs continue to attract attention as a potential stabilizing force. Since the start of 2026, these ETFs have accumulated roughly 3,800 BTC, slightly exceeding the 3,600 BTC purchased during the same period last year.
While this is a positive signal, context matters. In November alone, ETFs recorded net sales of approximately 54,000 BTC over a 30-day period. Although the outflows have since stopped, CryptoQuant cautions that stabilization should not be mistaken for renewed strength.
ETF flows appear to be preventing further deterioration rather than driving a fresh wave of demand.
Exchange Inflows: A Warning Sign for Short-Term Price Action
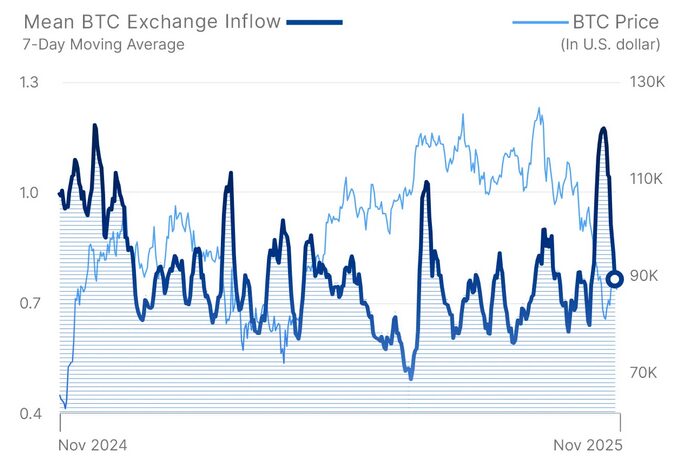
One of the more concerning developments highlighted in the report is the rise in Bitcoin inflows to centralized exchanges.
On January 16, the seven-day moving average of exchange inflows reached approximately 39,000 BTC, the highest level since late November 2025. Historically, increasing exchange inflows often precede heightened selling activity, as investors move assets to exchanges in preparation for liquidation.
While not all inflows result in immediate selling, the trend increases the probability of near-term downward pressure.
Broader Context: Macro, Institutions, and Structural Limits
Beyond CryptoQuant’s data, the broader crypto landscape reinforces a cautious stance.
- Macro uncertainty continues to affect risk assets, limiting aggressive capital deployment.
- Institutional participation, while real, remains selective and risk-managed rather than speculative.
- Regulatory clarity has improved in some regions, but compliance costs and capital requirements still constrain rapid expansion.
For blockchain practitioners, this environment favors sustainable infrastructure development over short-term price chasing.
Implications for Investors and Builders
For those searching for new crypto assets or revenue opportunities, CryptoQuant’s analysis suggests several practical takeaways:
- Avoid assuming that price rebounds equal trend reversals.
- Focus on cash-flow-generating models, such as infrastructure, custody, compliance tooling, and enterprise blockchain services.
- Use bear-market rallies for portfolio rebalancing, not excessive leverage.
- Monitor exchange flows and long-term moving averages as early-warning indicators.
In past cycles, the most resilient projects and strategies were built during precisely these uncertain periods.
Conclusion: Caution, Not Capitulation
Bitcoin’s recent rebound has reignited optimism, but CryptoQuant’s on-chain data paints a more restrained picture. Demand has stabilized but not expanded, ETF inflows have slowed the bleeding but not reversed it, and rising exchange inflows hint at renewed selling pressure.
History suggests that bear markets often test investors’ patience through convincing rallies before true structural recoveries emerge. Whether this cycle will ultimately follow that script remains uncertain—but for now, the data argues against complacency.
For investors and builders alike, the message is clear: optimism should be tempered by discipline, and conviction should be grounded in data, not narratives.
