Main Points :
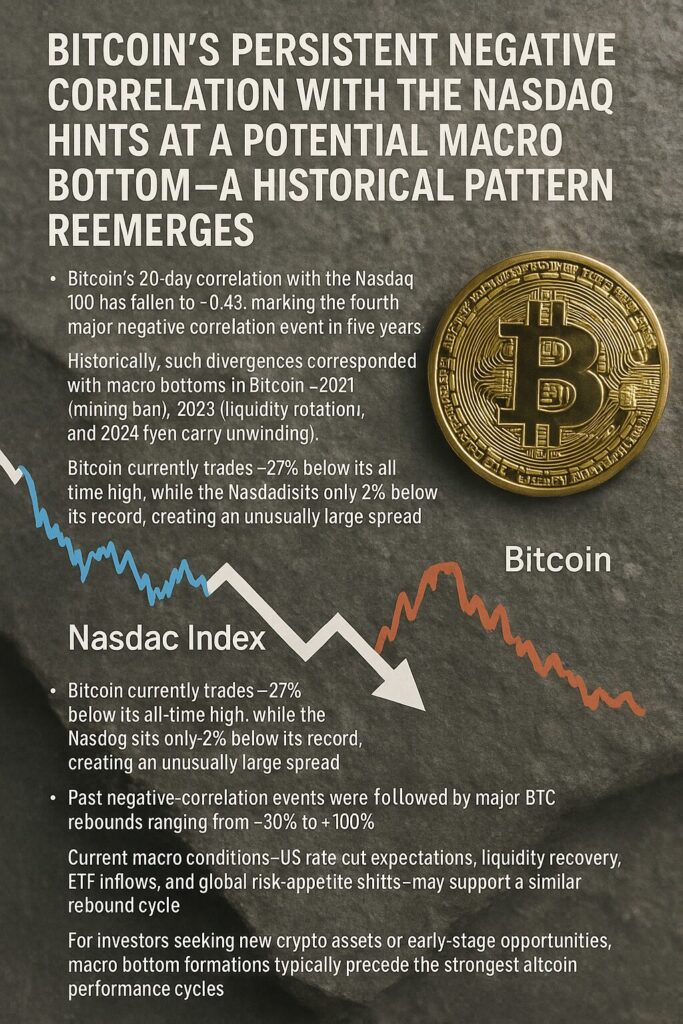
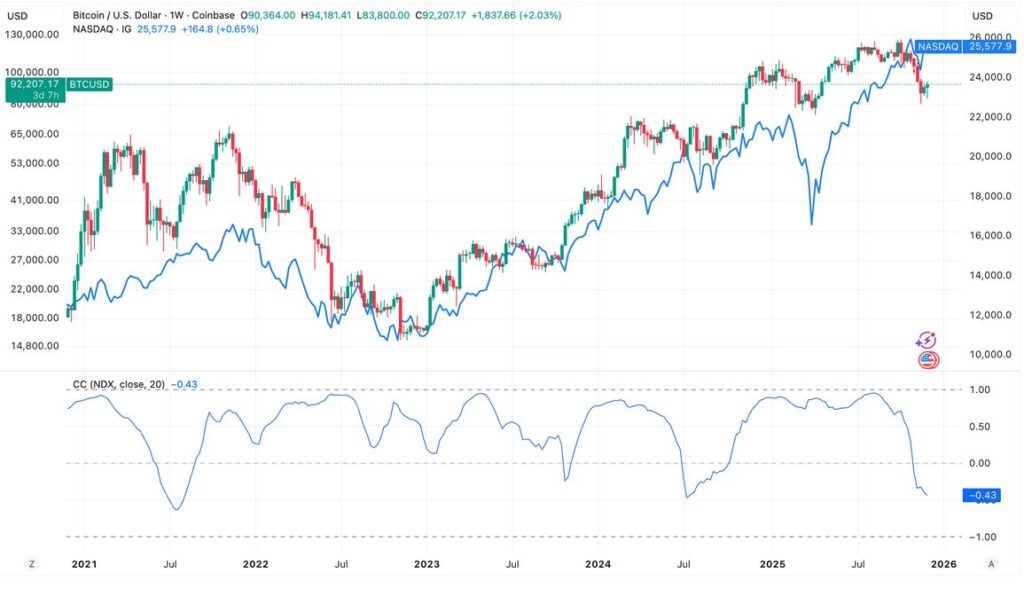
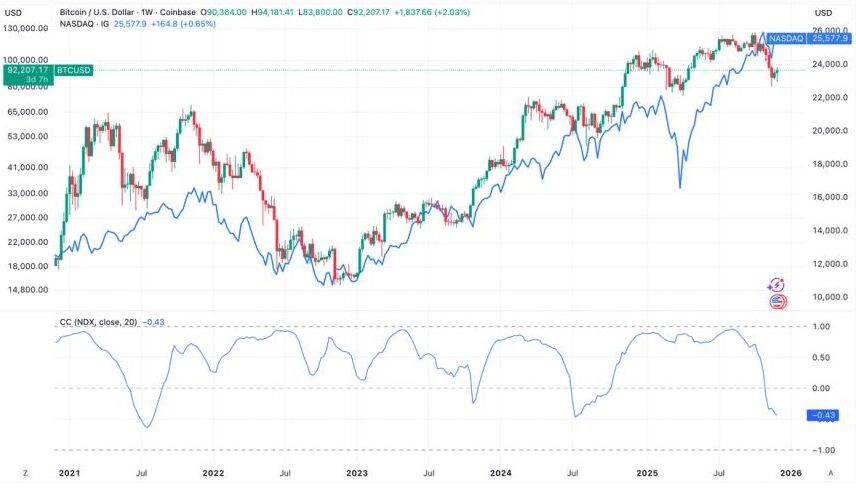
- Bitcoin’s 20-day correlation with the Nasdaq 100 has fallen to –0.43, marking the fourth major negative correlation event in five years.
- Historically, such divergences corresponded with macro bottoms in Bitcoin—2021 (mining ban), 2023 (liquidity rotation), and 2024 (yen carry unwinding).
- Bitcoin currently trades –27% below its all-time high, while the Nasdaq sits only 2% below its record, creating an unusually large spread.
- Past negative-correlation events were followed by major BTC rebounds ranging from +30% to +100%.
- Current macro conditions—US rate-cut expectations, liquidity recovery, ETF inflows, and global risk-appetite shifts—may support a similar rebound cycle.
- For investors seeking new crypto assets or early-stage opportunities, macro bottom formations typically precede the strongest altcoin performance cycles.
1. Introduction: A Rare Market Divergence Is Emerging Again
Bitcoin is once again moving out of sync with traditional risk assets. While the Nasdaq 100 remains near record highs—only about 2% below its peak—Bitcoin continues to trade 27% beneath its all-time high reached in October. Normally, Bitcoin behaves like a high-beta version of the tech sector, outperforming during risk-on phases and dropping more sharply during risk-off conditions.
However, the current divergence is far from ordinary. The 20-day rolling correlation between Bitcoin and the Nasdaq has fallen to –0.43, the lowest level observed since 2024 and one of the deepest negative readings in the past five years. This is noteworthy because previous negative correlation episodes closely matched Bitcoin’s macro bottom formations.
These divergences suggest that Bitcoin occasionally decouples from tech equities not due to weakness, but because it is transitioning between cycles—absorbing liquidity shocks, recalibrating risk positioning, and preparing for the next structural expansion phase. Understanding these divergences is essential for investors looking for emerging crypto assets and alternative revenue opportunities.
2. Historical Bottoms and Correlation Patterns
A consistent pattern has emerged over the past half-decade:
Whenever Bitcoin’s correlation with the Nasdaq turns sharply negative, a local or macro bottom tends to form.
(1) 2021 – Mining Ban Capitulation Bottom
- Correlation dropped deeply negative during China’s mining ban.
- BTC fell from ~$60,000 to ~$30,000.
- Within months, BTC rallied back to a new all-time high (~$69,000).
(2) September 2023 – Liquidity Rotation Bottom
- Correlation again turned negative as global liquidity tightened temporarily.
- BTC dipped slightly below ~$30,000.
- By year-end, BTC surged past ~$40,000 (+33%).
(3) August 2024 – Yen Carry Unwind Bottom
- Strong deleveraging in global markets caused a sudden negative correlation event.
- BTC dropped to ~$49,000.
- This became the cycle’s local low.
Now, in late 2025, the phenomenon is repeating with remarkable similarity. These patterns strongly suggest that negative correlation may function as an early signal of deeper market repositioning rather than weakness.
3. Why Is Bitcoin Lagging While Tech Stocks Surge?
Bitcoin’s decline of –36% from peak to trough contrasts sharply with the Nasdaq’s relatively modest –8% decline. Several macro and crypto-native factors explain this divergence:
3.1 ETF Flows Slowed After Record Inflows
Spot Bitcoin ETFs saw massive inflows earlier in the year, but momentum has cooled.
This temporarily impacted liquidity—even though long-term structural demand remains intact.
3.2 Miner Selling Pressure Increased
- Energy prices rose.
- Hashrate competition intensified.
- Miner treasury drawdowns increased selling pressure in the open market.
3.3 Altcoin Rotation Pulled Liquidity Away
Investors seeking higher returns began reallocating capital toward:
- BTC-L2 ecosystems
- AI-focused tokens
- RWAs (tokenized T-bills, tokenized credit products)
- Asian exchange-listed high-beta assets
This caused a temporary drag on Bitcoin dominance.
3.4 Macro Traders Are Positioning for 2026
Hedge funds and macro desks are rotating risk exposure ahead of:
- Expected 2026 U.S. rate cuts
- Projected global liquidity expansion
- Rising demand for non-USD collateral
Bitcoin may temporarily lag until liquidity fully unlocks.
4. Negative Correlation as a Forward Indicator of Reversal
In quantitative finance, persistent negative correlation between two typically aligned risk assets often indicates transition phases, not breakdowns. For Bitcoin, these phases historically precede:
- Volatility contractions
- Liquidity redistributions
- Market sentiment reset
- Strong upward cycle expansions
More importantly, past negative correlation periods were followed by major rallies:
| Event | Correlation Low | BTC Local Low (USD) | 90-Day Return |
|---|---|---|---|
| 2021 Mining Ban | ~–0.35 | ~$30,000 | +100% |
| 2023 Liquidity Rotation | ~–0.25 | ~$29,500 | +33% |
| 2024 Yen Carry Shock | ~–0.30 | ~$49,000 | +41% |
| 2025 (Current) | –0.43 | TBD | TBD |
The current reading of –0.43 is the deepest among all four events, strengthening the probability of a significant rebound.
5. Broader Market Trends Supporting a Potential Bottom
To fully understand the outlook, it is important to examine macro forces shaping Bitcoin’s environment.
5.1 Liquidity Conditions Are Set to Improve
Global liquidity cycles show early signs of expansion due to:
- US rate-cut expectations
- Rising Treasury buybacks
- Slowing inflation numbers
- Increasing demand for digital collateral
Historically, Bitcoin responds with a lag of 1–3 months after liquidity inflection points.
5.2 Institutions Are Increasing Exposure Again
Recent filings show growing interest in:
- Bitcoin ETF call-option overlays
- Multi-asset crypto portfolios
- RWA–crypto hybrid strategies
These adoption signals typically precede price recoveries.
5.3 Altcoin Markets Thrive After Bitcoin Bottoms
Historically:
- Bitcoin bottoms first
- ETH and L2 tokens rally second
- High-beta altcoins rally third
This cycle sequencing is vital for readers seeking new crypto asset opportunities.
5.4 Hashrate Stabilization Reduces Forced Selling
Recent miner data indicates stabilization in:
- Treasury selling
- Hashrate difficulty growth
- Energy-driven operational pressure
This reduces structural downward pressure on BTC.
6. What This Means for Investors Seeking New Opportunities
If history repeats—or even rhymes—the current environment may represent:
- The late stage of a macro consolidation cycle
- A potential bottom-formation window
- An opportunity zone preceding broad-based altcoin expansion
For investors actively searching for:
- New income-generating crypto assets
- Undervalued tokens with strong fundamentals
- Blockchain applications with real business utility
macro turning points like this often provide the best entry conditions.
7. Key Sectors Likely to Benefit If Bitcoin Rebounds
(1) Bitcoin Layer-2 Ecosystem (BTC L2s)
These networks benefit directly from BTC demand cycles.
Expect growth in:
- BTC-based DeFi
- Native yield protocols
- Rollups using BTC as base collateral
(2) Real-World Asset (RWA) Tokenization
This has become a major institutional narrative:
- Tokenized U.S. Treasuries
- Tokenized money-market funds
- Tokenized credit instruments
These assets historically expand during liquidity upcycles.
(3) AI-Crypto Hybrids
AI inference markets and GPU-sharing tokens gain during tech-driven risk cycles.
(4) Asia-Centric Exchange Tokens
Given regional growth in liquidity, these assets may outperform early in the rebound.
8. Final Analysis: Is Bitcoin Forming a Bottom?
All major indicators point toward a familiar pattern:
- Negative Nasdaq correlation
- Deepening undervaluation relative to tech equities
- Stabilizing miner dynamics
- Improving macro liquidity expectations
While precise timing remains uncertain, the structural setup resembles previous bottom formations with remarkable clarity.
Bitcoin may approach the final stage of its corrective cycle.
For investors seeking asymmetric crypto opportunities, the coming months may represent a critical observation window.
