Main Points :
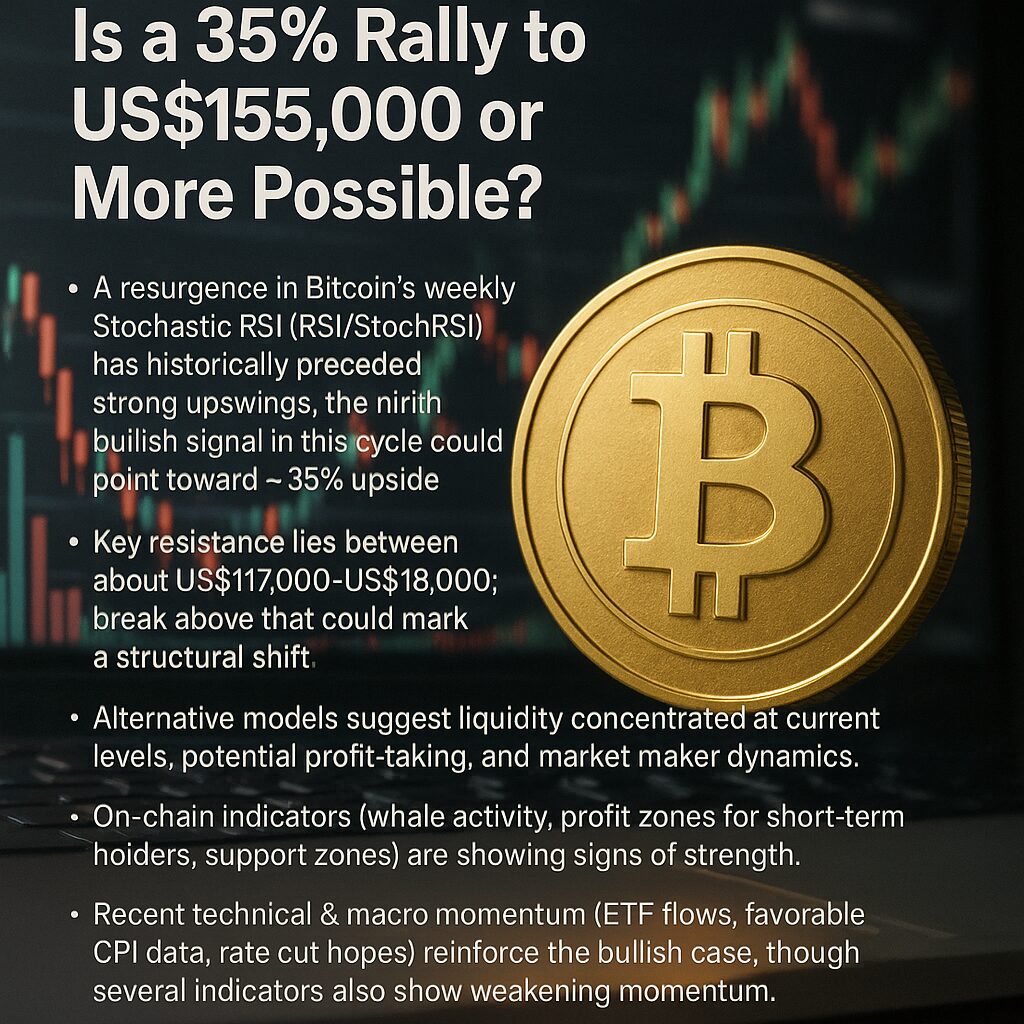
- A resurgence in Bitcoin’s weekly Stochastic RSI (RSI/StochRSI) has historically preceded strong upswings; the ninth bullish signal in this cycle could point toward ~35% upside.
- Key resistance lies between about US$117,000-US$118,000; break above that could mark a structural shift.
- Alternative models suggest even larger gains (e.g. >US$200,000) over a somewhat longer timeframe if macro-conditions align (rate cuts, institutional flows, etc.).
- However, short-term risks remain: liquidity concentrated at current levels, potential profit-taking, and market maker dynamics.
- On-chain indicators (whale activity, profit zones for short-term holders, support zones) are showing signs of strength.
- Recent technical & macro momentum (ETF flows, favorable CPI data, rate cut hopes) reinforce the bullish case, though several indicators also show weakening momentum.
Introduction: A Critical Moment for Bitcoin
Bitcoin (BTC) currently sits in a pivotal zone. Trading above US$115,000 and approaching resistance around US$117,000-US$118,000, the asset is drawing renewed attention from technical analysts and investors ahead of major macroeconomic events—most notably the upcoming U.S. Federal Open Market Committee (FOMC) interest rate decision. Market consensus is divided: optimists see potential for strong gains if certain technical thresholds are cleared; cautious voices point out fragilities in liquidity and momentum.
1. Bullish RSI Signal & the Case for 35% Upside
A central theme in recent analysis is the return of a bullish weekly stochastic RSI signal. According to reports, this is the ninth time this cycle that the signal has fired — prior instances have led to average rallies of about 35%. If history repeats itself, that could project Bitcoin toward US$155,000 from current levels.
The argument is bolstered by complementary models. For example, Timothy Peterson (as mentioned in the referenced article) suggests there is more than a 50% chance Bitcoin reaches within ~170 days. That model is sensitive to repeated pattern behavior rather than specific fundamental drivers.
2. Resistance & Structural Levels: What to Watch Now
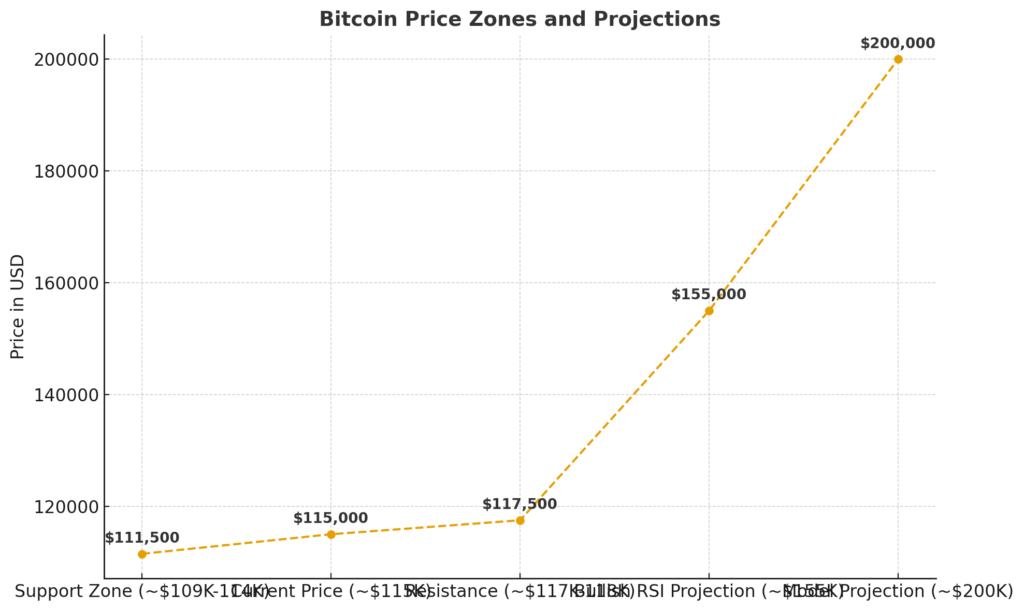
Resistance in the near term appears clustered around US$117,000-US$118,000: a zone where upside breakouts have so far failed. If BTC can decisively hold above US$115,000 and break through that resistance, many analysts view this as confirmation of bullish momentum.
Support levels are also important. Key support lies in the US$109,000-US$114,000 range: if price falls below that, risk of deeper correction increases.
3. Macro Drivers & Institutional Inflows
Beyond pure chart signals, macroeconomic data is helping strengthen the bullish thesis:
- U.S. CPI (Consumer Price Index) data that recently aligned with expectations has boosted confidence.
- Expectations for U.S. interest rate cuts are high, which could ease monetary tightening. Such rate cuts tend to benefit “risk-on” assets including Bitcoin.
- Institutional flows—especially in ETFs—are playing an increasingly important role. In recent weeks, spot Bitcoin ETFs have seen large inflows, which both reduce circulating supply and signal strong external demand.
These macro tailwinds are aligning with technical signals and on-chain behavior, potentially creating a synergistic effect.
4. On-Chain & Whale Behavior: Strengthening Signs
Some on-chain metrics are showing encouraging signs:
- Whales (large holders) have become active again; in one report, a wallet dormant for over 14 years transferred 10,000 BTC. While some of these are over-the-counter transactions (which may have limited impact on market price), such behavior tends to reflect sentiment shifts.
- Short-term holders (especially whales) are entering into profit zones, indicating previous support zones (e.g. ~US$108,000-109,000) have been defended.
- Liquidity, both buy and sell orders, appear concentrated in certain bands (around the resistance region), which could mean either strong breakout or strong rejection depending on how those orders are cleared.
5. Counterpoints & Risks
Despite the bullish case, there are several risks and warning signals that must be considered:
- Momentum indicators (e.g. some RSIs, MACD divergences) are showing signs of fatigue in parts. For example, while RSI supports the uptrend, strength is fading in some shorter timeframes.
- Liquidity issues: large sell orders (profit taking) near resistance might limit upside. Also, market makers could influence price action in this resistance zone, sometimes masking real demand.
- Macro uncertainty remains: inflation, geopolitical risk, and the actual decision of the U.S. FED (both its timing and size of cuts) will likely have outsized effects.
- If support fails (especially under ~US$110,000), the risk of correction increases substantially.
6. Recent Price Predictions & Forecasts
Pulling from a variety of sources, here are some of the recent forecasts:
| Time-horizon | Target Price | Likelihood / Caveats |
|---|---|---|
| Next few weeks | US$120,000-126,000 | Dependent on breaking resistance and sustaining demand from ETFs and institutional buyers. |
| ~170 days | US$200,000+ | As per some cyclic / pattern-based models. If macro tailwinds (rate cuts, favorable policy) continue. |
| Short downside risk | US$109,000 or lower | If resistance holds and momentum fails, losses could follow. |
Recent predictions from forecasting platforms (e.g. CoinCodex) suggest modest short-term gains (a few percent up) toward US$120,000 within a month, assuming current momentum holds.
7. Recent Developments That Reinforce or Challenge the Outlook
Several of the most recent data points align with the bullish narrative:
- Bitcoin has rallied about 4–5% in recent weeks, pushed up by revived hopes for U.S. rate cuts.
- Positive CPI data has removed some inflation-shock fears.
- Volatility remains relatively low around multi-month lows, suggesting consolidation before a potential breakout.
On the flip side:
- Some indicators already show weakening strength (e.g. RSI not extremely elevated but not surging; nonlinear risks from macro).
- Resistance at the US$117,000-118,000 range has proven difficult to overcome.
Conclusion
For those seeking new crypto assets or revenue sources and interested in practical blockchain applications, Bitcoin remains the anchor in the space. The combination of a historically reliable ninth bullish weekly RSI signal, growing institutional flows, favorable macro data, and reinforced on-chain support suggests that a ~35% rally to US$150,000-US$160,000+ is well within the realm of possibility—provided resistance is cleared and macro conditions hold.
However, this is far from guaranteed. The risk-reward balance becomes unfavorable if key support levels break, or if macro-pressure (interest rates, inflation surprises) intensifies. For practitioners interested in blockchain utilization and yield generation, holding exposure to Bitcoin makes sense as part of a diversified strategy, but plan for volatility and have exit/risk thresholds in place.
