Main Points:
- Setup Echoing Late-2024 Breakout — A trader known as Galaxy argues BTC is retesting a breakout trendline much like late 2024; that episode preceded roughly a 50% leg higher from ~$70,000 to ~$108,000. If the present retest holds, a similar magnitude move is on the table.
- Line in the Sand Near $109,300 — Rather than revisiting deeper lows, market chatter now treats January’s ~$109,300 peak as “ultimate support,” with the latest swing-low probe under ~$112,000 on Aug. 1 marking the third such higher-low since April.
- Flows and Positioning Turn Two-Sided — After nearly $1B in spot-ETF outflows late last week, funds saw net inflows again mid-week, while futures open interest cooled—conditions that can fuel sharp squeezes if spot re-accelerates.
- Macro and Seasonality Are Headwinds — August often brings shakier crypto performance, and tariff headlines are still leaning on risk appetite; bulls likely need clean closes above key levels to overpower those drags.
- Actionable Takeaways for Investors and Builders — Use $112,000–$109,300 as risk rails; watch ETF flow pivots and OI for timing; expect altcoin beta if BTC confirms; and align product roadmaps (payments, custody, yield) to a higher-vol regime with disciplined downside planning.
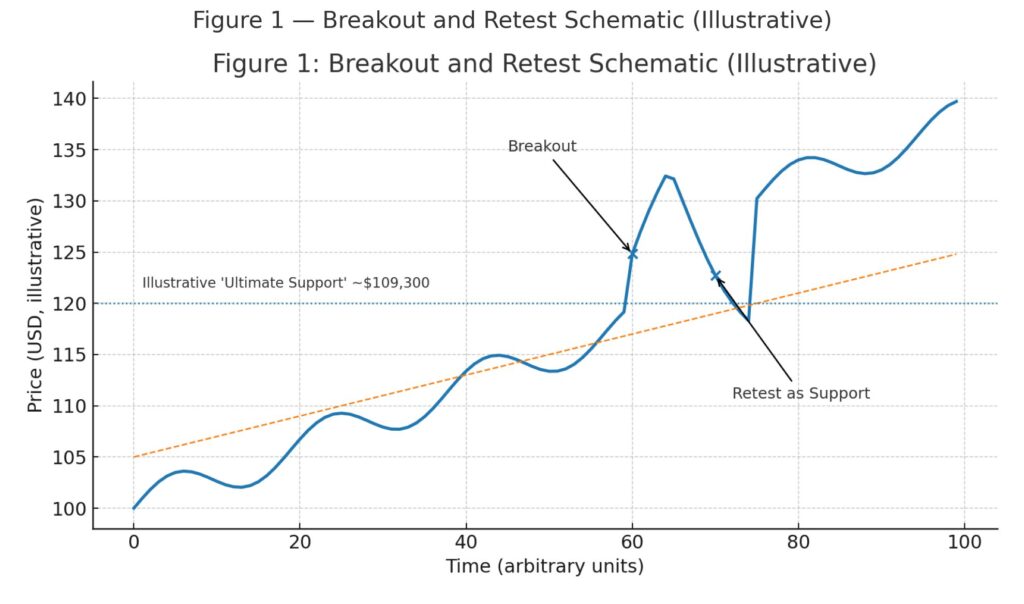
[Insert Figure 1 here — “Breakout and Retest Schematic (Illustrative)”. Download:]
1) What the original analysis says
The core claim is straightforward: if Bitcoin can hold a rising trendline it recently reclaimed, the market could be setting up for a repeat of the late-2024 dynamic—break out, retest former resistance as support, then expand into fresh highs. Galaxy’s latest read on X highlights that the last time this structure appeared, BTC rallied from roughly $70,000 to around $100,000–$108,000 before stalling—about a 50% run. The current three-day structure again shows a retest in progress, with the key difference that today’s trendline is ascending.
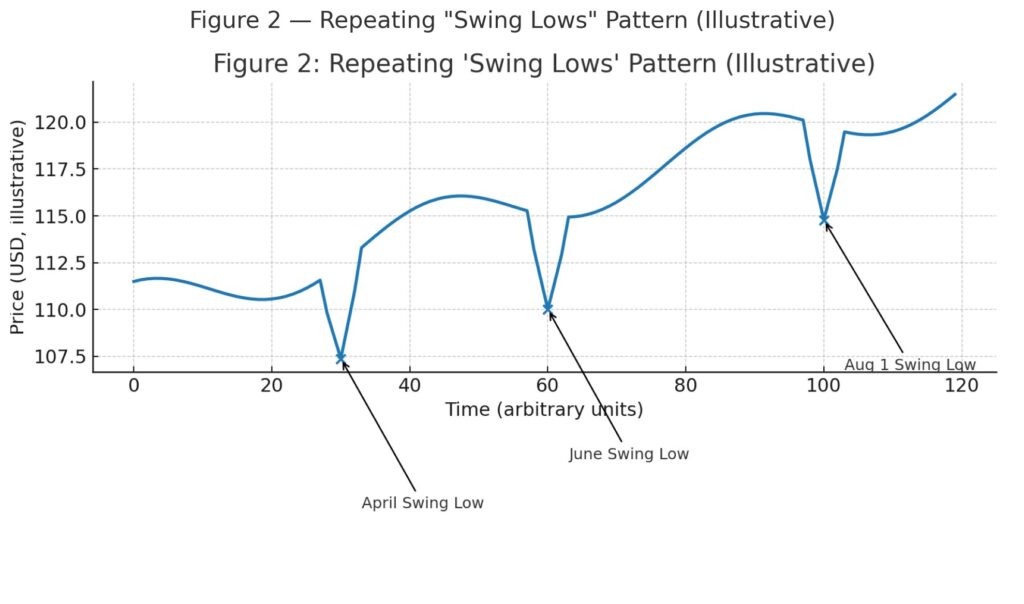
Importantly, the analysis frames January’s ~$109,300 high as a potential “ultimate support,” implying that a decisive loss of that level would invalidate the thesis. The Aug. 1 wick below ~$112,000 is cast as another “swing low” that—like similar lows in April and June—may not be revisited if the trendline defense sticks.
[Insert Figure 2 here — “Repeating Swing-Lows Pattern (Illustrative)”. Download:]
2) The key levels to watch (and why they matter)
$112,000 (spot wicks) — The Aug. 1 dip briefly under ~$112,000 sits squarely in the “swing-low” framework Galaxy mapped out. As long as these lows keep forming higher in the structure—and price does not close decisively below them—the market maintains a constructive posture.
$109,300 (“ultimate support”) — This number carries narrative weight because it marked a peak in January. While Bitcoin subsequently set a slightly higher record in May, many technicians still watch January’s print as a tidy round-trip threshold. Losing it would signal more than a routine retest.
Above $115,000–$117,000 (momentum zone) — In early August, BTC rebounded toward the mid-$110Ks, even as hedging activity remained cautious. A series of closes above the mid-$110Ks would strengthen the case that the retest is complete and momentum can re-assert.
ETF-flow pivots — The Block’s dashboard makes it easy to track when net flows flip from outflows to inflows (or vice versa). Sustained positive flow often coincides with or precedes durable uptrends; conversely, outsized outflows can weigh on price until they abate.
3) What’s different now vs. late 2024
Two contextual shifts matter.
First, the trendline itself is now rising, meaning buyers are defending higher ground—bullish in principle, but it also reduces margin for error: a failed retest on an ascending support often breaks faster.
Second, the macro backdrop features tariff headlines and lingering growth questions that periodically sour risk sentiment. Cointelegraph explicitly flags tariffs in its write-up; CoinDesk’s coverage this week noted how policy headlines and outflow bursts can pull BTC down even when spot rebounds quickly.
Seasonality adds friction. Research going into August called out Bitcoin’s tendency to wobble into late summer and highlighted the $112,000 area as a plausible shakeout zone before the next directional push. That’s exactly where we just wicked.
4) Flows, positioning, and volatility fuel
Two forces have been tug-of-war all week:
- Spot-ETF flows: After nearly $1B in outflows across late last week, U.S. spot ETFs showed a day of renewed inflows (~$90M) mid-week—small, but directionally important. When that pattern persists for several sessions, trend traders pay attention.
- Derivatives positioning: Futures open interest slid from late-July highs, signaling reduced participation into the bounce. That can set the stage for sharper moves if spot lurches higher and shorts need to cover.
Put differently, fragile positioning + improving flows is a recipe for fast trend re-acceleration—provided the retest holds. If it doesn’t, the same mix can exacerbate downside via forced deleveraging.
5) Does $109,300 still matter if BTC hit higher highs later?
Yes, because markets remember clean, obvious numbers—and because that January breakout was where a large body of participants mentally anchor. While Bitcoin pushed to a marginally higher all-time high in May (just under ~$109,500 intraday), the January print remains a clear, sticky reference point across analyses this week. If price cleanly loses that level on volume, the “ultimate support” narrative breaks, and technicians shift to deeper ranges.
6) Scenarios from here (and how to act on them)
Bullish continuation (base case if retest holds)
- Closes above the mid-$110Ks, ETF net inflows persist, and OI rebuilds.
- Path opens to re-test prior highs and extend into the $130Ks+ over weeks. Several technical reads published in July targeted the mid-$140Ks on a measured-move extension after a channel break—consistent with a rough 30–50% expansion from retest zones.
Chop & fake-outs (volatile range)
- Flows flip flop, OI stays muted, and BTC oscillates between ~$112,000 and ~$118,000.
- Options skew and funding chop; altcoin beta rotates by sector rather than broad risk-on.
Bearish break (invalidates the thesis)
- Multiple closes below ~$112,000, accelerating toward or through ~$109,300.
- ETF outflows re-intensify; a deeper retrace into the high-$100Ks becomes likely, in line with some seasonal warnings.
Risk rails and triggers
- For swing trades, many are keying risk to $112,000–$109,300.
- For tactical entries, 10x Research highlighted $111,673 as a retest level that would improve risk/reward for bulls.
7) What’s new since the last major highs—and why it matters
A few trend-relevant developments have landed in recent weeks:
- Corporate treasury demand hasn’t gone away. Michael Saylor’s company disclosed another ~21,021 BTC purchase between July 28 and Aug. 3—among its largest dollar-value buys—reaffirming institutional conviction on dips. This kind of sticky demand can harden support bands during drawdowns.
- ETF plumbing continues to evolve. Galaxy’s weekly research recapped regulatory progress on in-kind creations/redemptions for crypto ETFs, an incremental but meaningful step toward more efficient fund operations—something that can smooth flow transmission into spot over time.
- Risk appetite remains two-sided. CoinDesk tallied sizeable outflows last week amid tariff chatter, then a quick rebound toward ~$115,000 with hedging still elevated—evidence that macro headlines can knock price around but haven’t killed the trend.
8) Implications for investors looking for the next income stream
Our readership tends to hunt for new assets and practical revenue in the crypto stack. Here’s how this setup translates:
- Bitcoin-beta strategies — If the retest holds, liquidity likely rotates first into BTC and then into selective large-caps. Systematic rotation into strong-trend sectors (L2 infrastructure, real-world asset rails, high-throughput chains) can capture second-order beta while limiting tail risk to BTC’s rails. Track ETF flows (for BTC), then OI and funding for alt timing.
- Yield and basis — Calm derivatives with rebuilding OI are ripe for cash-and-carry or delta-hedged approaches if annualized premiums expand into trend continuation. If outflows resume and basis compresses, pivot toward liquidity provisioning on stables and high-quality perps with strict drawdown stops.
- Payments and practical adoption — Higher, steadier BTC supports merchant-acceptance pilots and cross-border treasury rails. For fintechs and EMIs/VASPs, align compliance-first BTC on-/off-ramp products with transparent fees in USD; add automated tax-lot and travel-rule tooling to turn volatility into stable revenue rather than PnL risk.
- Treasury and custody — If your organization holds BTC, codify risk bands around $112,000 and $109,300 for staged rebalancing. If price confirms up, scale DCA above the retest on a rules-based schedule; if it breaks down, pause adds and let the market present cleaner premiums.
9) A short checklist to navigate the next 2–4 weeks
- Daily: Check U.S. spot-ETF net flows and 5-day rolling totals. Sustained positive prints often predate trend legs.
- Daily: Watch futures open interest and funding rate flips; fading OI into spot strength can foreshadow squeezes.
- Levels: Treat $112,000 and $109,300 as invalidation bands; treat sustained closes above $115,000–$117,000 as confirmation toward prior highs.
- Macro: Keep a tab on tariff and policy headlines; they’ve mapped cleanly into outflow spikes and risk-off wobbles.
Conclusion: The retest that could reset the tape
Markets rarely hand out the same trade twice—but sometimes they rhyme. Galaxy’s argument is that BTC is again kissing a reclaimed trendline, just as it did before a roughly 50% surge late in the last cycle leg. The difference this round is an ascending line, a heavier macro tape, and more visible ETF plumbing. If BTC can defend the $112,000–$109,300 shelf and flows lean back positive, the path of least resistance is another measured expansion toward the $130Ks–$140Ks over weeks. If it can’t, the seasonal bear case gets oxygen, and $100Ks come back into focus. Either way, the playbook is clear: respect the levels, respect the flows, and let the market prove it.
