Key Points :
- Bitcoin spot trading volume has dropped to 2023 lows, signaling weak organic demand
- Recent price increases are driven more by liquidations and news than real buying pressure
- Whale inflow momentum is surging, indicating potential volatility ahead
- Declining open interest suggests position unwinding rather than new capital inflow
- Institutional participation remains stable but not aggressive
1. A Rally Without Demand: Understanding the Weak Foundations
Bitcoin’s recent price movement above $71,700 has captured attention across the cryptocurrency market, but beneath the surface, the structural integrity of this rally appears fragile. Unlike previous bull runs fueled by strong spot demand and sustained capital inflows, the current upward movement is increasingly driven by external catalysts such as macro news events and derivatives market dynamics.
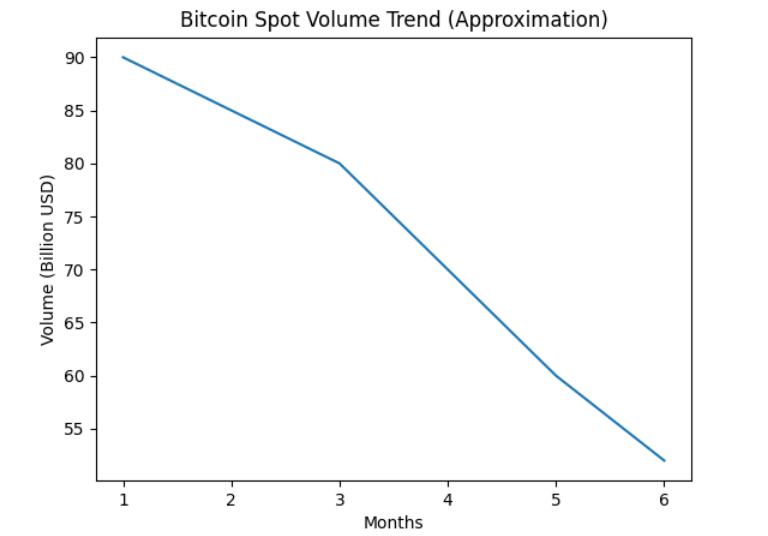
The most concerning signal comes from Binance, the world’s largest cryptocurrency exchange by volume. Spot trading activity on the platform has declined to approximately $52 billion in March, marking the lowest level since September 2023. During that earlier period, Bitcoin was still navigating the aftermath of a prolonged bear market, making the comparison particularly significant.
This decline suggests that fewer market participants are actively engaging in spot buying, which is typically considered the most reliable indicator of genuine demand. Without strong spot volume, price increases tend to lack durability and are more susceptible to rapid reversals.
[Bitcoin Spot Volume Trend]
2. Exchange Flows Reveal a Passive Market Structure
Beyond raw trading volume, exchange flow data provides deeper insight into market behavior. Over a seven-day period, Binance recorded cumulative flows of approximately $6.38 billion, while Coinbase saw $5.14 billion.
What is notable is not just the absolute numbers, but the trend: Binance flows have dropped to their lowest levels since 2024. This indicates a reduction in deposit activity, meaning fewer coins are being moved onto exchanges for trading purposes.
Interestingly, this decline in inflows is matched by a similar decrease in outflows, suggesting that the market is not actively distributing or accumulating at scale. Instead, it reflects a state of equilibrium with low participation.
Coinbase, on the other hand, shows relatively stable flows, which may indicate continued involvement from long-term investors, particularly institutional participants in the United States. However, stability does not equate to growth—there is no clear evidence of aggressive accumulation.
3. Whale Activity Signals Hidden Market Tension
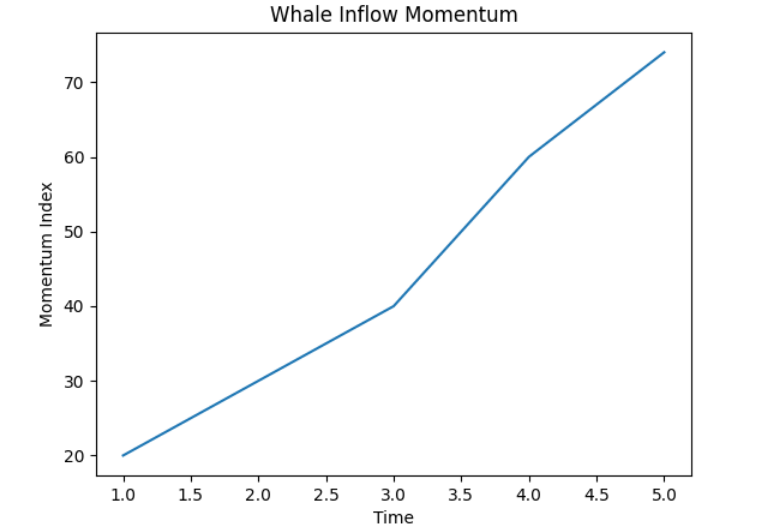
While retail and general market participation appear subdued, whale activity tells a different story. The “whale inflow momentum” metric—tracking large transfers into exchanges—has surged dramatically.
Currently, the metric stands at 74.3, surpassing all cycle peaks over the past 11 years except for a spike in 2015. Such elevated levels suggest that large holders are actively repositioning their capital, either preparing to sell, hedge, or rotate into other assets.
This divergence between low retail participation and high whale activity often precedes periods of heightened volatility. Whales, by nature, have the capacity to influence price movements significantly, especially in low-liquidity environments.
[Whale Inflow Momentum]
4. Liquidation-Driven Price Action: A Technical Rally
The catalyst for Bitcoin’s recent surge appears to be geopolitical news involving a temporary delay in potential conflict related to Iran. However, the market reaction was less about the news itself and more about its impact on leveraged positions.
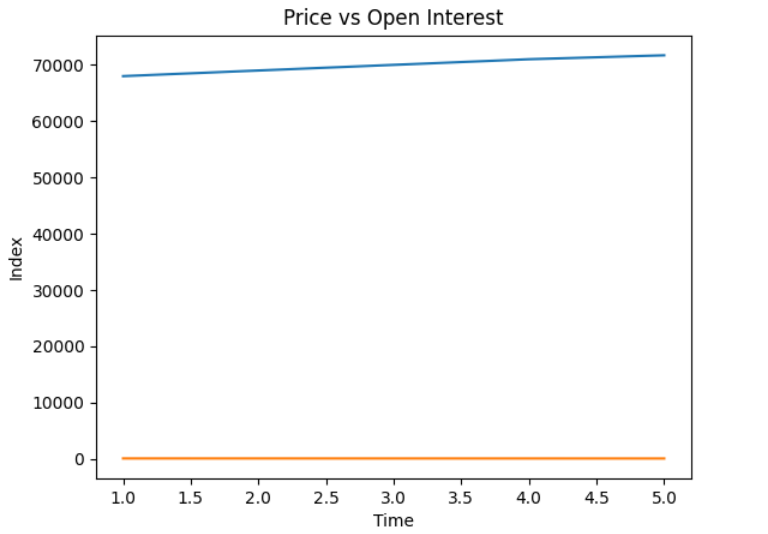
As prices rose, a significant number of short positions were liquidated. Within a single hour, over $44 million in short liquidations occurred on Binance. This forced buying pressure pushed prices higher, creating the illusion of strong upward momentum.
However, data shows that open interest—representing the total number of active futures contracts—declined by approximately 9,700 BTC (around 4%) during the rally. This is a critical signal.
In a healthy bull market, price increases are typically accompanied by rising open interest, indicating new capital entering the market. In contrast, a decline in open interest during a price rise suggests that the movement is driven by position closures rather than new investments.
[Price vs Open Interest]
5. Coinbase Premium and Institutional Hesitation
Another important indicator is the Coinbase premium, which remains negative. This metric compares Bitcoin prices on Coinbase (a proxy for U.S. institutional demand) with other exchanges.
A negative premium indicates that U.S. buyers are not aggressively bidding up prices. In previous bull cycles, a positive premium often signaled strong institutional inflows.
The current situation suggests that while institutions are not exiting the market, they are also not driving the rally. This reinforces the narrative that the recent price movement lacks strong foundational support.
6. Broader Market Context: 2026 Trends and Implications
Looking beyond this specific event, the broader cryptocurrency landscape in 2026 is characterized by several key trends:
- Increased institutional infrastructure but selective capital deployment
- Growing importance of derivatives markets in price discovery
- Reduced retail participation compared to previous cycles
- Expansion of alternative Layer 1 and real-world asset (RWA) tokens
For investors seeking new opportunities, this environment suggests a shift away from momentum-driven trading toward more strategic positioning. Assets with strong utility, revenue generation mechanisms, or integration into financial infrastructure may outperform purely speculative tokens.
At the same time, Bitcoin’s role as a macro asset remains intact. However, its short-term price behavior is increasingly influenced by liquidity conditions and derivatives positioning rather than organic demand.
7. Strategic Takeaways for Investors
For readers interested in new crypto assets, revenue opportunities, and practical blockchain applications, several insights emerge:
- Be cautious of news-driven rallies
Price increases without volume support are often unsustainable. - Monitor whale behavior closely
Large inflows to exchanges can signal upcoming volatility. - Focus on real demand indicators
Spot volume, exchange flows, and institutional premiums provide more reliable signals than price alone. - Diversify beyond Bitcoin
Emerging sectors such as RWAs, DeFi infrastructure, and cross-chain solutions may offer better risk-adjusted returns. - Understand market mechanics
Liquidations and derivatives play a significant role in modern crypto markets.
Conclusion
Bitcoin’s recent rally above $71,700 may appear bullish at first glance, but a deeper analysis reveals a market driven more by technical factors than genuine demand. Declining spot volume, weak exchange flows, and negative institutional premiums all point to a lack of strong participation.
At the same time, rising whale activity introduces an عنصر of uncertainty, suggesting that significant capital movements are underway beneath the surface. Combined with liquidation-driven price action, this creates a market environment that is both fragile and volatile.
For investors, the key is not to chase short-term price movements, but to understand the underlying dynamics shaping the market. In an era where liquidity and positioning often outweigh fundamentals, disciplined analysis and strategic allocation will be critical to navigating the next phase of the crypto cycle.
