Main Points :
- On-chain metrics suggest that Bitcoin has entered a late phase of its market cycle, echoing patterns from past cycles (2015-2018, 2018-2022).
- Long-term holders (LTHs) are realizing significant profits; supply is in profit for long durations above +1 standard deviation bands. Sell pressure is growing.
- Profit taking remains high though volume from profit realization appears weaker than during prior all-time high (ATH) attempts. Losses on short-term are modest.
- New demand, especially from short-term holders (STHs) and newly minted wallets (<1 month old), is rising and absorbing coins from LTHs; whales are accumulating and exchange outflows support reduced immediate sell pressure.
- However, indicators like sentiment, derivative/liquidity flows, and “buy the dip” behavior historically precede deeper drawdowns; price zones around $110,000–$115,000 (US$) are critical support/resistance.
- Historically, after similar stages, ATHs occurred in 2–3 months; yet risk of correction or contraction remains if certain thresholds (e.g. below ~$110,000) are breached.
1. Late-Cycle Signals from Profitability and Supply in Profit
Glassnode metrics show Bitcoin’s circulating supply has now remained above the +1 standard deviation profit band for 273 days straight.
This compares to 335 days in the 2015-2018 bull run—making the present run one of the longest sustained periods of high profitability in supply.
Long‐term holders (defined often as those holding >155 days) have realized more profit in this cycle than almost all comparable past cycles. This suggests that many who have held through the earlier bull run are now taking profits.
These patterns reinforce the view that the cycle is in its historically late phase. In past cycles, similar conditions were followed by new all-time highs within about 2–3 months.
2. Weakening Momentum: Profit Taking, Flat Capital Inflows
While profit taking from LTHs is rising, metrics like growth in realized market cap have slowed. Recently, Bitcoin’s realized market cap growth has been about 6% per month, compared to ~13% during the breakout toward $100,000 in late 2024.
Profit‐taking volumes at recent highs (around $70,000, $100,000, $122,000) were large; the latest spike (around $124,000) showed weaker profit realization compared to previous highs.
Despite some drawdowns (e.g. ~9% drop from $124,000), realized losses remain modest — on the order of US$112 million/day, a level historically seen in local corrections, not major capitulations.
3. Renewed Demand: Short-Term & New Holders, Whales, Exchange Flows
Against the backdrop of profit taking, demand signals are showing signs of life:
- Wallets under one month old have added ~73,702 BTC in September.
- Short-term holders’ (STHs) holdings have increased by ~159,098 BTC, absorbing coins being offloaded by LTHs.
- Whales (wallets holding between 10 BTC and 10,000 BTC) have added over 56,000 BTC since late August.
- Exchange balances (coins held on exchanges, which tend to represent more ready to sell supply) have fallen by ~31,000 BTC in the past month—suggesting less immediate selling pressure.
These are encouraging signs: typically, late in bull cycles, some holders realize profits, but new demand tries to soak up supply, attempting to push price higher.
4. Caution Flags: Sentiment, Derivatives, Liquidity
Several warning signs temper optimism:
- Market sentiment (per Santiment) has turned more negative since BTC dropped below ~$114,000. Fear has increased, but not yet capitulation.
- Short positions in derivatives are not yet large enough to generate a classic short squeeze if price rises sharply. This limits potential upside surprises.
- Retail eagerness to buy dips has often preceded further dips historically—these “dip buy” moments can be traps if downward momentum builds.
- Consolidation is occurring: Bitcoin is trading in a range between ~$110,000-$116,000, with $114,000-$116,000 being a key resistance zone, and ~$108,000 to $110,000 a critical support area. A breakdown below support could risk more substantial downside.
5. Recent Context & Goldman’s Flesh: Post-FOMC, Options & Open Interest
Recent macro and derivatives market behavior also adds texture:
- After the Federal Reserve’s FOMC meeting, there was moderate momentum for Bitcoin; derivatives markets (perpetuals, options) have shifted from risk-off to more balanced, while spot markets show moderate selling pressure.
- Perpetual open interest peaked at ~395,000 BTC and has cooled a bit, ~380,000 BTC. Options open interest has reached a record ~500,000 BTC ahead of a large expiry date. These expiries (e.g., September 26) may influence spot price dynamics, especially around “max pain” levels.
- On-chain, ~95% of supply is in profit, and holding a cost basis around US$115,200 is seen as key: staying above that level maintains momentum; falling below could risk sliding toward ~$105,500 support.
What Might Happen Next
Given the above, here are plausible scenarios and what to watch for, especially for people seeking new crypto assets or revenue sources.
- Scenario A: Final Push to New Highs
If demand from STHs, new wallets, and whales continues, and resistance zones around ~$114,000-$116,000 are broken, Bitcoin could make another run toward all-time highs. Historically, other cycles saw ATHs ~2-3 months after similar late-phase signals. - Scenario B: Consolidation or Pullback
If support around ~$110,000 fails, or if sentiment deteriorates further, there could be a correction or extended consolidation. Price could drift down to ~$90,000-$105,000 depending on stress and leverage unwind. - Scenario C: Divergence & Rotation
Even if BTC stalls or corrects, new revenue opportunities may arise in altcoins, layer-1/2s, DeFi, or infrastructure protocols that benefit from rising demand for utility (e.g. scaling, cross-chain). Investors might look for projects with strong fundamentals, low correlation to BTC, or those addressing pain points in blockchain usage (fees, UX, regulatory compliance).
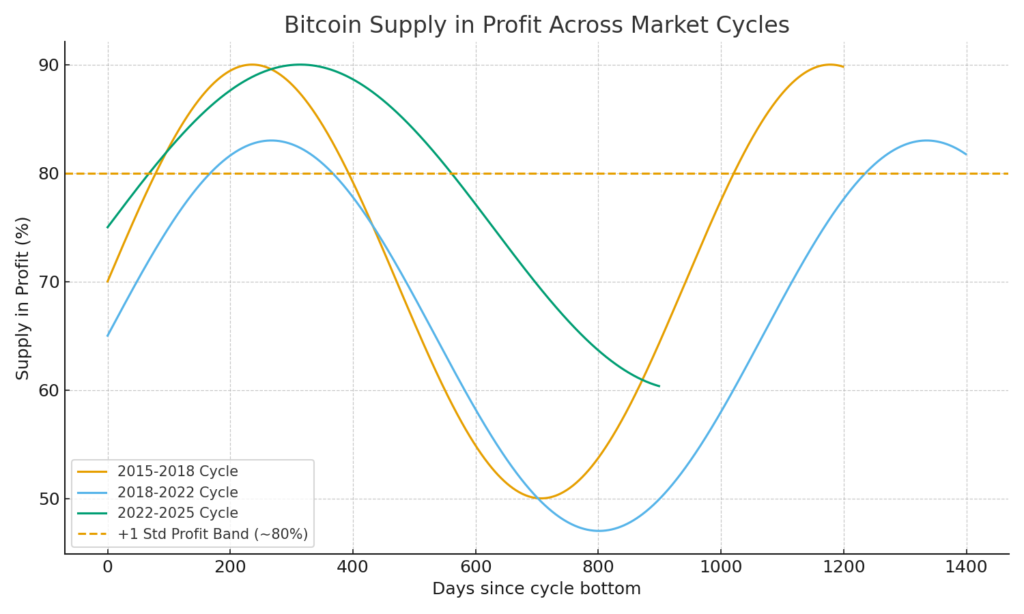
Graph / Chart Insertion Suggestion
A chart showing Bitcoin’s supply in profit vs. time (with lines for +1 standard deviation profit band) from past cycles (e.g. 2015-18, 2018-22, current) could visualize how long supply has stayed in high profitability.
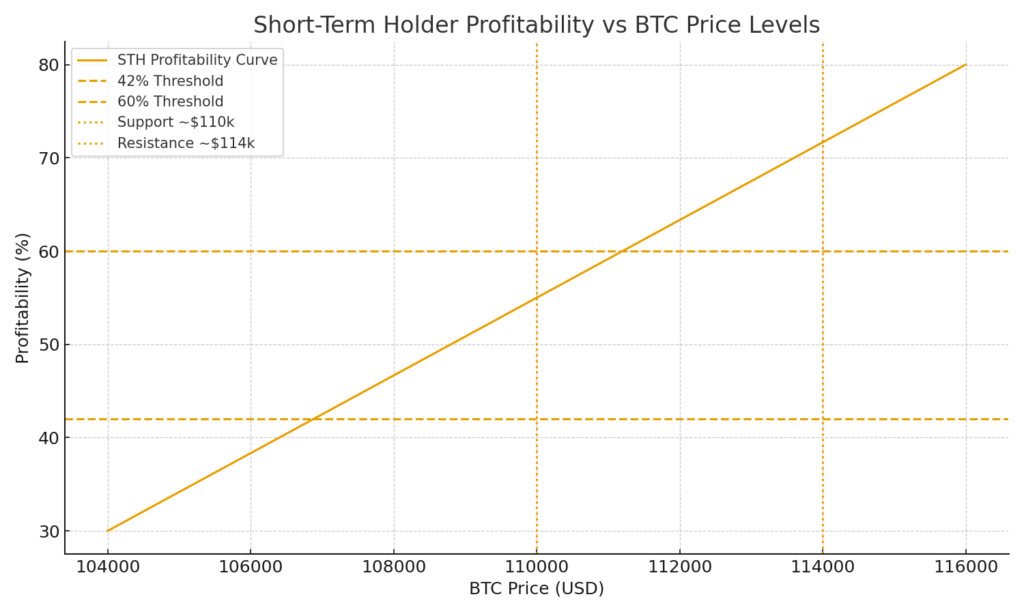
Another useful chart: Short-term holder profitability (% in profit) vs. price levels, showing thresholds like 42%, 60%, etc., aligned with price zones ($104k-$116k).
Conclusion
In sum, the evidence from multiple on-chain sources suggests Bitcoin is in a historically late stage of its bull market cycle. Long-term holders are already realizing significant profits, the supply has stayed in highly profitable zones for a long stretch, and demand is thinning slightly while buyer fatigue may be creeping in.
Yet it is not time to write the top just yet: short-term and new holders are showing renewed accumulation, whales are still adding, and key support levels remain. For those exploring new crypto assets or revenue streams, this may be a moment to be selective: diversify, monitor governance and utility, examine whether projects have real deliverables, and watch BTC closely—because its behavior often sets the tone for the wider market.
For anyone making investment or operational decisions: keep a close eye on those resistance and support zones (especially ~$114,000-$116,000 and ~$110,000), the pace of realized profit taking, and whether sentiment begins to capitulate or derivatives markets unwind.
