Main Points :
- Bitcoin (BTC) on the daily chart appears to be forming a classic bear-flag pattern, suggesting continuation of the downtrend.
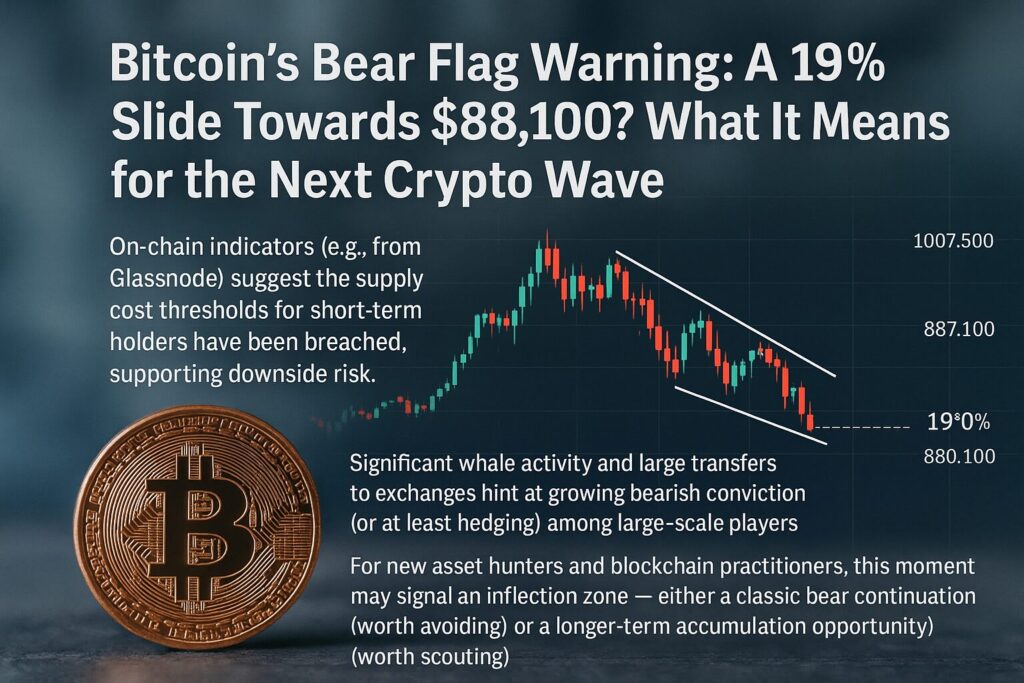
- A confirmed breakdown below roughly $107,500 (or $10 ×10³ = $107.5 k) could open the door to a target around $88,100, implying about 19 % drop from current levels.
- On-chain indicators (e.g., from Glassnode) suggest the supply cost thresholds for short-term holders have been breached, supporting downside risk.
- Significant whale activity and large transfers to exchanges hint at growing bearish conviction (or at least hedging) among large-scale players.
- For new asset hunters and blockchain practitioners, this moment may signal an inflection zone — either a classic bear continuation (worth avoiding) or a longer-term accumulation opportunity (worth scouting).
1. Understanding the Bear Flag Pattern
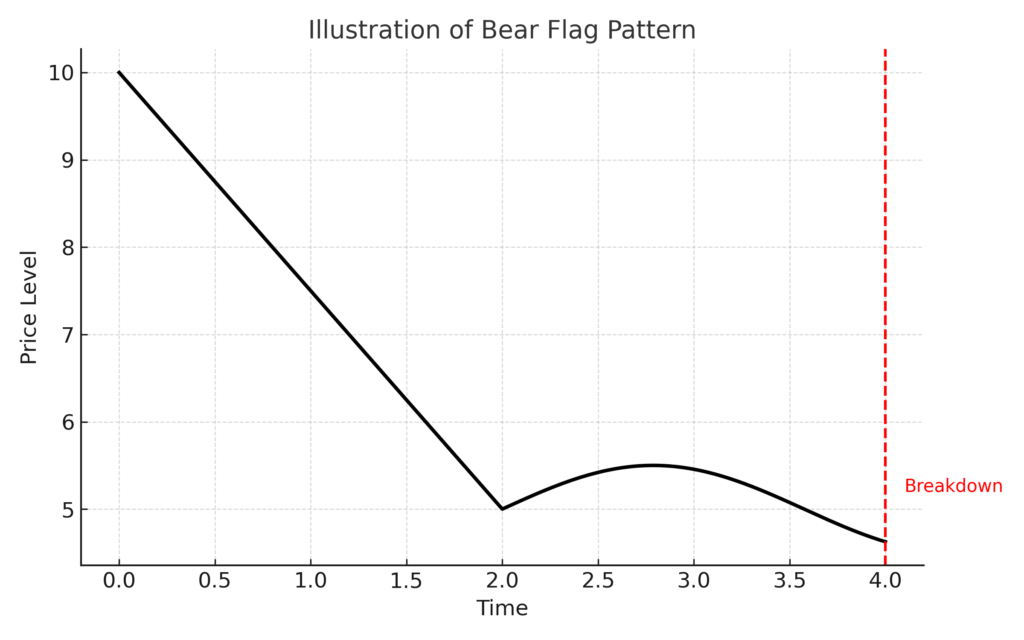
A “bear flag” is a technical-chart pattern typically seen as a continuation of a down-trend. The structure comprises:
- A sharp decline (the “flagpole”).
- A period of consolidation or mild retracement forming a tilted or horizontal channel (the “flag”).
- A breakout downward from the lower edge of that channel, signalling resumption of the decline.
In the case of Bitcoin (BTC), the pattern under discussion is visible on the daily chart. According to recent commentary, after a bottom around $103,530 (≈$103.53 k) on October 11, consolidation has occurred in a channel whose support is currently near $107,500. A breakdown below that level would technically validate the pattern and carry a target near $88,100.
Why this matters: For traders and asset seekers, the bear-flag suggests that what looks like a pause could in fact be a springboard for more downside. Recognising this may help avoid entering risk-assets prematurely, or alternatively, position for a deeper correction/accumulation zone.
2. Current Bitcoin Price Structure & Key Levels
On the latest daily chart:
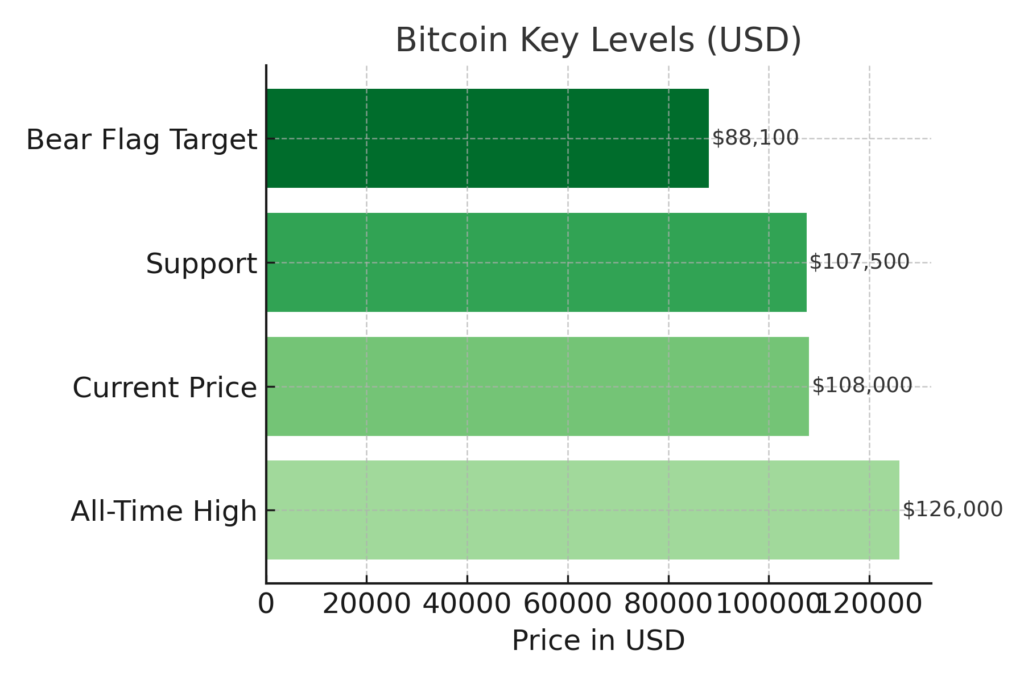
- BTC recently tested the support around $107,500. A decisive daily close below this level would confirm the bear-flag breakdown.
- The measured target from the flag’s size comes to around $88,100, representing approximately a 19 % drop from current levels (~$108,000).
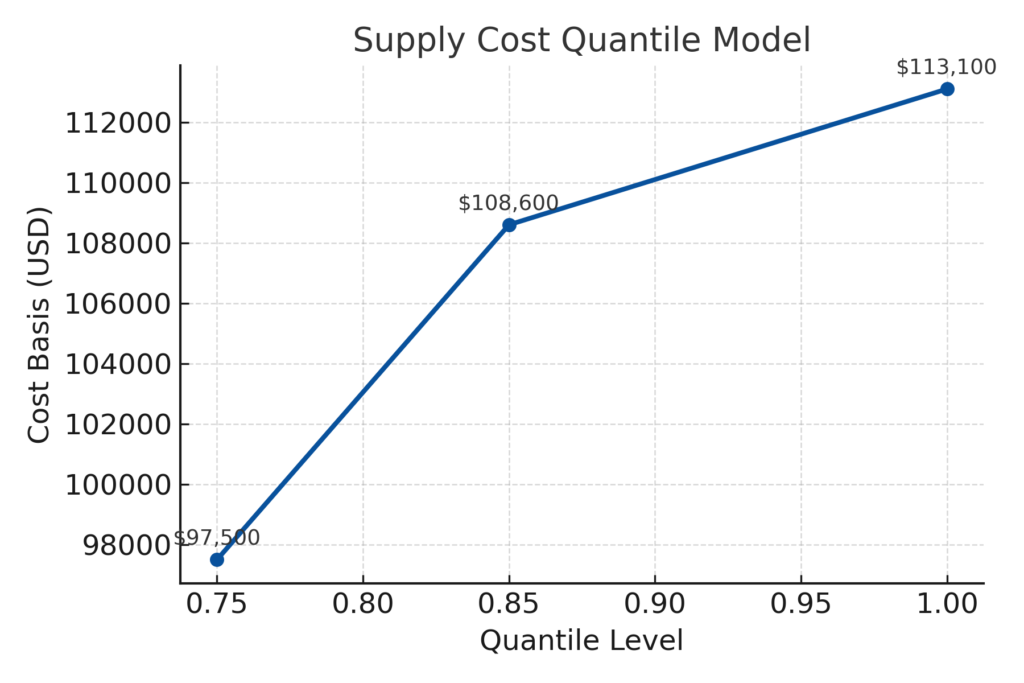
- On-chain data: Glassnode’s supply cost quantile model indicates that if the ~$108,600 (0.85 quantile) level fails to hold, the risk of weaker structure increases, and the ~$97,500 (0.75 quantile) zone becomes relevant.
- Whale behaviour: Large transfers (~5,252 BTC, ~US$588 m) to exchanges + new ~$234 m short positions suggest institutional/whale hedge activity.
For asset-seekers: the ~$107.5 k support is a gatekeeper level. Should it hold, the pattern remains unconfirmed (and risk may be lower). Should it break, >10–20 % downside is plausible.
3. What’s Behind the Technical Weakness?
Several factors converged to raise downside risk:
Supply-cost threshold breach
If many holders acquired BTC at ~US$113,100 (≈$113.1 k) (short-term cost average), the fact that price sits below that increases pressure to sell or at least reduces confidence in holding. Glassnode notes this kind of structure often signals start of a mid-term bearish phase.
Macro / institutional signals
- Whale/institution moves: as cited above.
- The crypto market’s correlation with equities and macro risk remains elevated: risk-off sentiment tends to hit BTC.
- Forecasts from Elliott-Wave analysts (e.g., Jon Glover) suggest BTC may trade between US$70k-80k during a prolonged bear phase into late 2026.
Chart structure
The bear flag itself is a high-probability continuation pattern if the conditions (sharp drop → consolidation → breakdown) are met. Volume behaviour matters: often volume contracts during consolidation then spikes on breakdown.
For blockchain practitioners or crypto investors seeking new assets: this moment is worth watching because if BTC declines meaningfully, it may pull the broader market (alts, DeFi, infrastructure tokens) lower — but also create opportunities for leveraged or strategic accumulation.
4. Implications for New Asset Hunters & Blockchain Use-Cases
For investors seeking new cryptos / income sources:
- A deeper BTC correction can create entry points in smaller tokens or infrastructure protocols (e.g., layer-1s, bridging projects, DeFi stacks) that often lag BTC in both directions.
- But risk rises: if BTC drops 15–20 %, broader market contraction may impair token launches, fundraising, or even project viability for sub-50 m-market-cap assets. Thus, adopt selective risk-management.
- One strategy: monitor projects with real-world use (e.g., payments, tokenization, enterprise blockchain) whose valuations may be less tied to pure crypto-sentiment swings, thereby offering relative resilience. This aligns with your interest in practical blockchain applications.
For blockchain infrastructure / practical use-cases:
- Recessions or corrections often weed out weaker business models. Projects that survive may emerge stronger post-bear. Use this time to audit token-economics, partnerships, regulatory outlook.
- Wallets, bridges, infrastructure layers may see discounted valuations, making for strategic acquisitions (token allocations) ahead of next cycle.
- If BTC slides, stablecoins, payments rails, and cross-chain infrastructure may absorb migration flows — aligning with your interest in asset-defence, payments, remittances.
Key take-away: This isn’t purely about whether BTC goes to $88k or $70k. It’s about whether the broader market shift gives early movers (in projects you can evaluate) a chance to build or invest at underlying value levels. The bear-flag alerts you that time may be narrowing.
5. Risks & Alternative Scenarios
- False breakdown: Every chart pattern can fail if macro or sentiment flips. For example, if BTC reclaims $110 k+ decisively, the bear flag may invalidate and lead to a strong bounce.
- Duration: Even if BTC drops, timing matters — accumulation phases can last months. For projects and tokens, dead-money risk exists.
- Market-specific factors: Regulatory events, ETF approvals, large fund inflows could flip sentiment quickly, overriding technicals.
- Altitude of drop: The US$88,100 target is measured from the pattern — but tail-risk could push lower (US$70k-80k) if macro worsens. (See Glover forecast).
For you as a crypto-asset strategist and blockchain implementer: track both charts (technical) and fundamentals (token-ecosystem health, partnerships, use-cases). The bear-flag is a red-alert, not a final verdict.
6. What to Watch Going Forward
- Daily close below ~$107,500: Confirm pattern, target US$88,100 becomes more likely.
- Volume behaviour: Does the flag consolidation show decreasing volume, and does breakdown show increasing volume (classic pattern).
- On-chain metrics: Short-term holder cost base, supply on exchanges, whale movements.
- Macro/whale signals: Large BTC → exchange transfers; institutional fund flows; regulatory news.
- Alternative scenario: A strong reclaim of ~$110 k-$115 k would breach bear-flag thesis and tilt toward bullish continuation.
For implementation: Consider staging alerts (e.g., set tracker on $107.5 k breach). For tokens/projects: evaluate what happens if liquidity dries up (bear market) vs. what happens when cycle renews (bull market). Prepare accordingly.
Conclusion
The formation of a bear-flag on Bitcoin’s daily chart is a significant warning for the broader crypto-market. A confirmed breakdown under ~$107,500 could open a path toward ~$88,100 (≈19 % downside) — and possibly lower if broader macro pressure builds. For those hunting new assets, this is both a risk and an opportunity: risk because market contraction can hurt speculative tokens, but opportunity because value builds during correction. For blockchain infrastructure and practical use-cases, corrections often create the space for real strengthens to emerge.
Whether you’re looking for the next big crypto asset, a practical blockchain application, or an entry point in infrastructure — now is the time to sharpen your evaluation skills, watch key levels, and decide how you position for either a deeper slide or the off-cycle accumulation.
