Main Points :
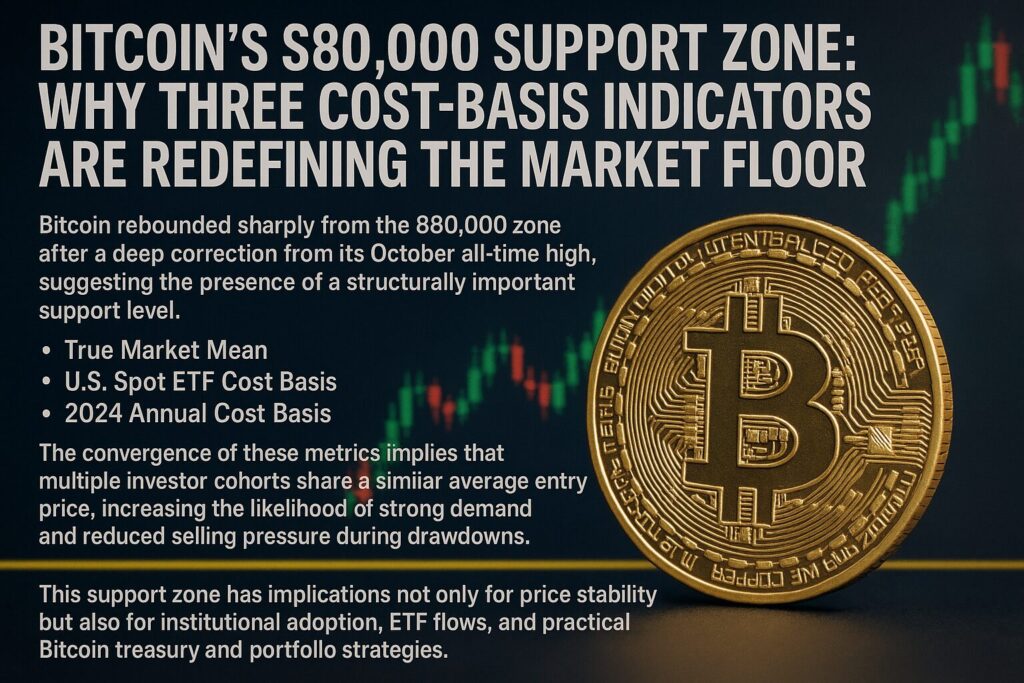
- Bitcoin rebounded sharply from the $80,000 zone after a deep correction from its October all-time high, suggesting the presence of a structurally important support level.
- Three independent cost-basis indicators—the True Market Mean, U.S. spot ETF cost basis, and the 2024 annual cost basis—are tightly clustered in the low-$80,000 range.
- The convergence of these metrics implies that multiple investor cohorts share a similar average entry price, increasing the likelihood of strong demand and reduced selling pressure during drawdowns.
- This support zone has implications not only for price stability but also for institutional adoption, ETF flows, and practical Bitcoin treasury and portfolio strategies.
1. Market Context: From All-Time Highs to Structural Support
Bitcoin’s recent market behavior reflects a familiar but critical pattern in its long-term cycles. After reaching a new all-time high in October, the asset experienced a sharp correction that tested investor conviction across both retail and institutional segments. Prices retraced rapidly toward the $80,000 level, a move that initially raised concerns about a deeper bear-market-style drawdown.
Instead, the market responded differently. Bitcoin found buyers decisively in the low-$80,000 range and rebounded more than 15%, later trading back above $90,000. This reaction suggests that the correction was not merely a technical pullback, but a test of a structurally meaningful support zone.
What distinguishes this episode from previous cycles is not only the speed of the rebound, but the alignment of several on-chain and off-chain indicators pointing to the same price region. Rather than relying on a single metric, analysts now observe a convergence of cost bases across distinct investor groups—active on-chain participants, U.S. ETF investors, and the 2024 acquisition cohort.
This convergence provides a data-driven explanation for why demand intensified near $80,000 and why selling pressure diminished rapidly at that level.
2. Understanding Cost Basis as a Market Signal
Before examining each indicator individually, it is important to clarify why cost basis matters. In simple terms, cost basis represents the average price at which a group of investors acquired their Bitcoin. When market price approaches this level, investor behavior tends to change.
If price falls significantly below cost basis, investors may panic and sell to limit losses. Conversely, when price revisits or slightly undercuts cost basis during a broader uptrend, investors are statistically more likely to hold or even add to positions, viewing the level as “fair value.”
In Bitcoin markets, cost basis analysis has become particularly powerful because on-chain data allows analysts to observe real acquisition prices, not just abstract technical levels. When multiple cost-basis indicators cluster tightly, the psychological and structural importance of that zone increases substantially.
3. True Market Mean: The Cost Basis of Active Participants
The first indicator reinforcing the $80,000 support zone is the True Market Mean. This metric represents the average on-chain purchase price of Bitcoin held by active market participants. Crucially, it excludes long-dormant coins that have not moved for extended periods, thereby focusing on investors most likely to transact in the current market environment.
During the recent drawdown, the True Market Mean sat near $81,000, acting as a clear floor for price action. Bitcoin briefly tested this level but did not meaningfully trade below it, signaling that active holders were unwilling to sell at a loss.
The historical context strengthens this interpretation. Bitcoin first moved decisively above the True Market Mean in October 2023 and has not sustained trading below it since. In prior cycles, reclaiming and holding above this metric often marked the transition from consolidation to structurally bullish conditions.
In that sense, the True Market Mean around $81,000 now functions as a long-term regime threshold. As long as Bitcoin remains above it, the broader market structure favors accumulation rather than distribution.
4. U.S. Spot ETF Cost Basis: Institutional Anchoring
The second pillar of support comes from the U.S. spot Bitcoin ETF cost basis. This metric reflects the weighted average price at which Bitcoin flowed into U.S.-listed spot ETFs, calculated by combining daily ETF inflows with contemporaneous market prices.
According to Glassnode data, this cost basis currently stands at approximately $83,844. The significance of this level lies in the nature of ETF investors. Unlike short-term traders, ETF participants often include asset managers, pension-linked strategies, and long-term allocators who rebalance portfolios rather than trade aggressively.
During earlier periods of stress—such as the April sell-off linked to macroeconomic and tariff concerns—Bitcoin also rebounded near the ETF cost basis. The recent reaction followed a similar pattern, reinforcing the idea that institutional capital views the low-$80,000 range as a strategic accumulation zone.
This behavior effectively transforms ETF cost basis into a passive but powerful support mechanism. As long as ETF investors remain net holders rather than net sellers, dips toward their average entry price are likely to attract renewed inflows rather than trigger mass exits.
5. The 2024 Annual Cost Basis: Cohort-Based Demand
The third indicator, the 2024 annual cost basis, tracks the average price at which Bitcoin acquired in 2024 was withdrawn from exchanges. This metric focuses on a specific investor cohort—those who entered the market during the current year.
Data from Checkonchain places this cost basis near $83,000. Historically, annual cohort cost bases have acted as dynamic support during bull markets. When price revisits these levels, it signals that newer investors are still in profit or near breakeven, reducing the incentive to sell.
In the current context, the 2024 cohort represents a mix of retail re-entrants and newer institutional players responding to ETF approval and improving regulatory clarity. Their shared cost basis near $83,000 adds another layer of demand to the broader $80,000–$84,000 support zone.
6. Convergence: Why the $80,000 Zone Matters
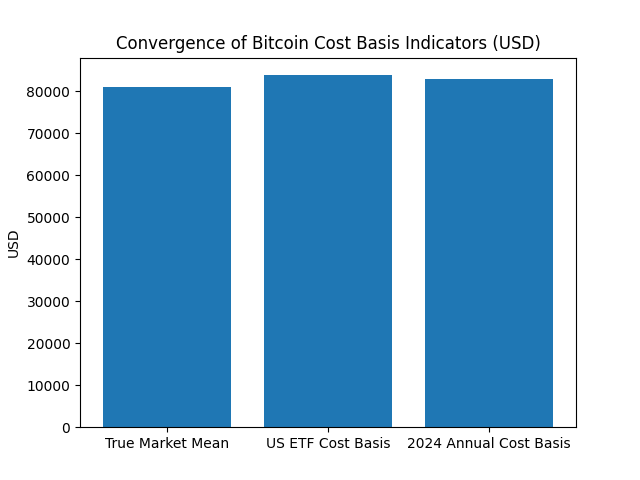
Individually, each of these indicators would be noteworthy. Together, they form a compelling structural narrative. The True Market Mean, ETF cost basis, and 2024 annual cost basis all converge within a narrow range spanning roughly $81,000 to $84,000.
This clustering implies that multiple, otherwise distinct investor groups—active traders, institutional ETF holders, and recent market entrants—share a similar perception of Bitcoin’s fair value. As a result, selling pressure weakens dramatically in this zone, while buying interest intensifies.
From a market microstructure perspective, such convergence increases liquidity depth and reduces downside volatility. For traders and long-term investors alike, this creates a reference zone that can inform risk management, position sizing, and portfolio construction.
7. Implications for Investors and Blockchain Practitioners
For readers seeking new crypto assets or revenue opportunities, the implications extend beyond short-term price action. A structurally supported Bitcoin market encourages broader experimentation and adoption across the blockchain ecosystem.
- Portfolio Strategy: Bitcoin holding above its composite cost basis supports strategies such as systematic accumulation, collateralized lending, and treasury allocation.
- Institutional Confidence: Stable ETF cost bases reinforce the role of Bitcoin as a portfolio diversifier rather than a speculative outlier.
- Ecosystem Development: Reduced downside risk at the market level allows developers and enterprises to plan longer-term blockchain integrations with less exposure to abrupt market shocks.
In practical terms, Bitcoin’s resilience near $80,000 strengthens its function as a monetary base layer within the broader digital asset economy.
8. Conclusion: A Market Floor with Structural Depth
Bitcoin’s rebound from the $80,000 region is not a coincidence, nor is it purely technical. It reflects the alignment of three independent cost-basis indicators, each rooted in a different segment of the market. Together, they define a zone of structural support that underpins the current bull-market phase.
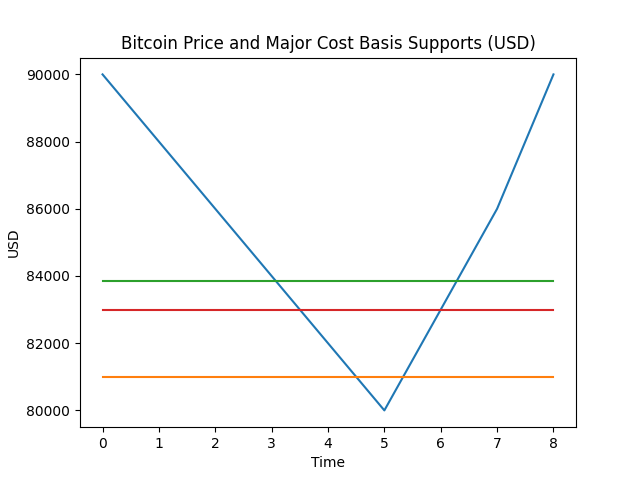
While no support level is guaranteed indefinitely, the depth and breadth of demand evident in this range suggest that Bitcoin’s market floor is now anchored by a diverse and resilient investor base. For those exploring new opportunities in crypto, understanding these dynamics is essential—not only for timing entries, but for appreciating how Bitcoin’s role continues to evolve as a global financial asset.[Insert Figure 1 here]
Bitcoin Price and Major Cost Basis Supports (USD)
Download image
[Insert Figure 2 here]
Convergence of Bitcoin Cost Basis Indicators (USD)
Download image
