Main Points :
- Bitcoin has fallen roughly 40% from its October peak, triggering fears of a repeat of the 2018 or 2022 crypto crashes—but structural conditions are fundamentally different.
- Institutional adoption, regulated investment products, and a looser monetary environment are acting as downside buffers absent in previous cycles.
- Several bottoming indicators—spot volume spikes, extreme negative funding rates, and mass long liquidations—are historically associated with market reversals.
- While downside risks remain, the probability of an 80% drawdown within a year appears significantly lower than in prior crypto winters.
- For investors seeking new crypto assets, yield opportunities, and practical blockchain use cases, this phase may represent transition rather than collapse.
Market Anxiety Returns as Bitcoin Slides 40%
Bitcoin’s recent price action has unsettled even seasoned market participants. After peaking in October, the asset has declined by approximately 40%, including an 11% drop in a single week, reigniting memories of the brutal bear markets of 2018 and 2022.
In those prior cycles, similar drawdowns marked the early stages of prolonged crypto winters, eventually resulting in losses exceeding 80% over roughly one year. Unsurprisingly, market narratives have begun to revive the so-called “four-year cycle” theory, suggesting that Bitcoin is once again entering a deep, multi-year downturn.
However, recent analysis from K33 challenges this interpretation. While acknowledging the “uncomfortable similarities” in price behavior, the firm argues that a full historical replay is unlikely—and that today’s market structure is materially different.
The Four-Year Cycle: Dead, Dormant, or Misunderstood?
Just months earlier, K33’s head of research had publicly stated that the four-year Bitcoin cycle was effectively over. This framework—long tied to Bitcoin halvings—has historically guided investor expectations, with predictable boom-and-bust phases roughly every four years.
Recent volatility has forced a partial reassessment. Price patterns do resemble past downturns, particularly in terms of speed and sentiment deterioration. Yet focusing solely on chart similarities risks ignoring the macro and structural context.
Unlike 2018 or 2022, Bitcoin today exists within a financial ecosystem that includes:
- Spot and derivatives ETFs
- Regulated custodians and brokers
- Bank-integrated crypto services
- Broad institutional access via advisors and asset managers
These elements did not exist at scale in previous cycles—and their presence changes how capital enters and exits the market.
The Self-Fulfilling Prophecy Risk
One of the most important insights from K33’s analysis is behavioral rather than technical. Market participants who believe a repeat crash is inevitable may act in ways that help make it happen.
As prices fall:
- Long-term holders begin trimming positions to lock in profits.
- New capital hesitates, waiting for “lower prices.”
- Selling pressure increases, reinforcing bearish narratives.
This feedback loop mirrors previous cycles, even when underlying fundamentals differ. What makes the current situation notable is that this dynamic is unfolding despite billions of dollars flowing into regulated Bitcoin investment vehicles and expanded institutional access.
Why an 80% Crash Is Unlikely This Time
The strongest argument against a 2022-style collapse lies in what is not happening today.
The 2022 downturn was exacerbated by a cascade of forced deleveraging events: highly leveraged funds collapsed, credit evaporated, and systemic failures triggered indiscriminate selling. The resulting contagion accelerated losses far beyond what spot market dynamics alone would have produced.
In contrast, the current market shows:
- No major forced liquidation events
- No large-scale credit contraction
- No structurally leveraged entities unraveling simultaneously
- A generally accommodative monetary environment
These factors significantly reduce the probability of a rapid, deep drawdown comparable to past crises.
Bottoming Signals Begin to Appear
Despite bearish sentiment, several indicators commonly associated with market bottoms have begun flashing.
Spot Market Volume Spike
On February 2, Bitcoin spot trading volume surged to over $8 billion as prices tested the 2025 lows. Historically, such abnormal volume spikes during downtrends often coincide with capitulation events, where weak hands exit and stronger holders absorb supply.
Bitcoin spot trading volume spike near local lows

Derivatives Market Reset
In derivatives markets, approximately $1.8 billion in long positions were liquidated over a short period. This purge pushed both open interest and funding rates deep into negative territory.
This combination—low open interest plus negative funding—has historically preceded price stabilization or reversal, as speculative excess is flushed out of the system.
Funding rates and long liquidations reaching extreme lows
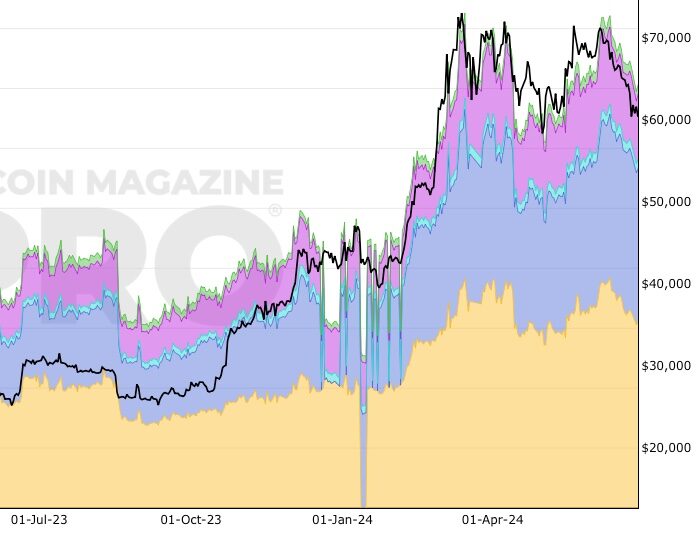
Key Technical Levels to Watch
From a price-structure perspective, several levels are now critical:
- $74,000: Primary support zone
- $69,000: Former 2021 peak, psychological and technical support
- $58,000: Approximate 200-week moving average
A decisive break below $74,000 could accelerate selling toward the lower zones. However, the lack of urgency among long-term holders suggests that even a deeper pullback may be orderly rather than catastrophic.
Flat Long-Term Returns Change Investor Behavior
An often overlooked point is that Bitcoin’s returns over the past two years have been largely flat. This dramatically alters holder incentives.
When unrealized gains are modest, long-term investors feel less pressure to sell, reducing reflexive downside momentum. In prior cycles, large accumulated profits amplified panic selling once prices turned.
This structural shift may help explain why, even amid sharp declines, selling pressure has remained contained relative to past crashes.
Is the Crypto Winter Already Here?
Not all analysts are as optimistic. Some argue that the market has effectively been in a crypto winter since early 2025.
Historical price patterns suggest that Bitcoin tends to bottom roughly 13 months after a cycle peak. If this rhythm holds, the current phase could represent the late stage of a downturn, rather than its beginning.
Under this view, the market may already be transitioning toward accumulation rather than further collapse.
What This Means for Opportunity Seekers
For readers focused on new crypto assets, yield generation, and real-world blockchain applications, the distinction between collapse and transition is crucial.
Periods like this historically favor:
- Infrastructure and middleware projects over pure speculation
- Yield-bearing strategies with transparent risk
- Blockchain use cases tied to payments, settlement, and tokenization
- Selective accumulation rather than broad market exposure
Rather than signaling the end of opportunity, the current environment may be laying the groundwork for the next phase of sustainable growth.
Conclusion: A Drawdown, Not a Déjà Vu
Bitcoin’s 40% decline is undeniably painful—and sentiment has deteriorated accordingly. Yet equating this move with the onset of a 2018- or 2022-style collapse overlooks key structural changes.
Institutional participation, regulated financial products, and the absence of systemic leverage all point toward a different kind of cycle—one defined less by violent unwinds and more by transitional consolidation.
While vigilance is warranted, the data increasingly suggests that this is not a replay of past disasters, but a recalibration phase in a maturing market. For those prepared to look beyond price charts, this period may prove to be less an ending—and more a strategic beginning.
