Main Points :
- Bitcoin’s recent ~30% decline is fully consistent with historical bull-market corrections, not the beginning of a long-term bear market.
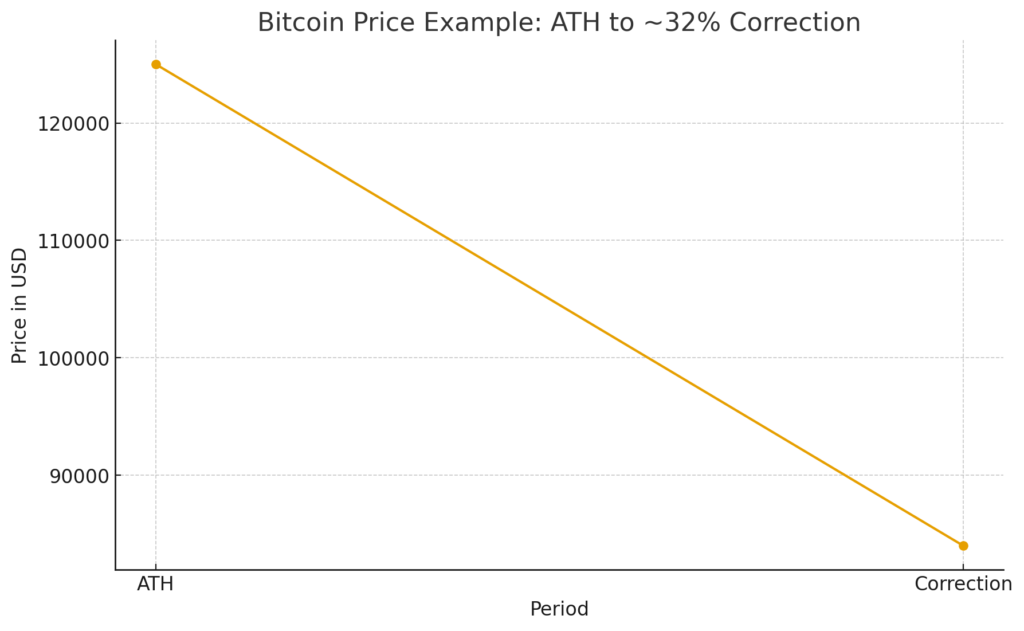
- Grayscale identifies this as the 9th major correction in the current cycle, with past averages also around 30%.
- The long-held “four-year cycle myth” is rejected—Grayscale predicts no bear market in 2026.
- Market structure is evolving: price discovery is increasingly driven by institutions, ETFs, and corporate treasuries, not retail speculation.
- Macro conditions such as expected U.S. interest-rate cuts and clearer regulations are creating a “fundamentally stronger environment” than past cycles.
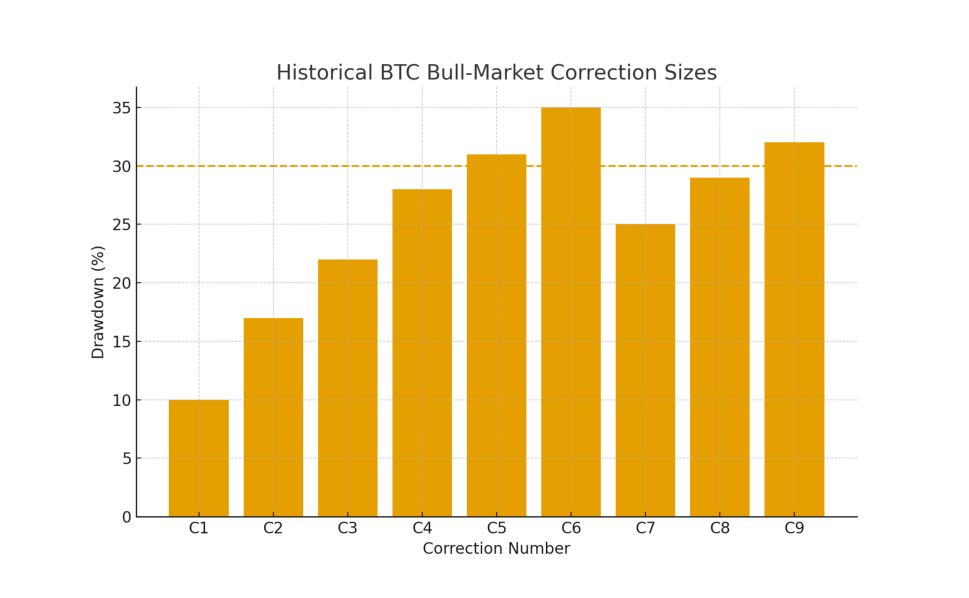
- Grayscale forecasts a new all-time high in 2026, with some analysts projecting $250,000 BTC.
Introduction: A Volatile Drop That Signals Strength, Not Weakness
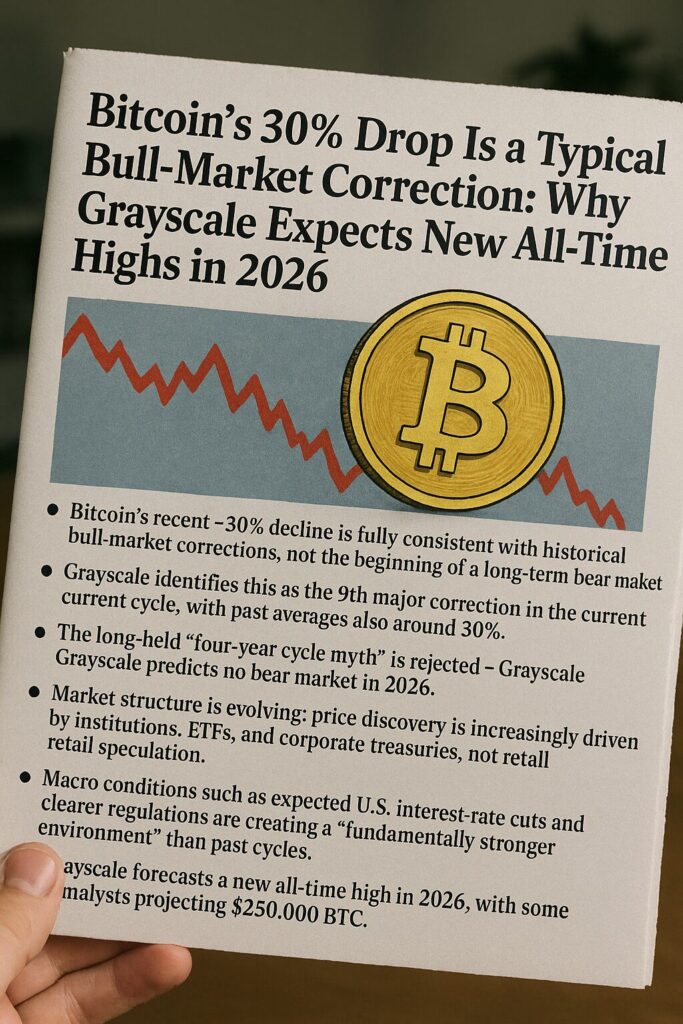
Bitcoin’s sharp decline from its early-October all-time high near $125,000 to the late-November low of $84,000 startled many investors. The magnitude of the move—roughly 32%, or a drop of over $41,000 in USD terms—invited fears that the bull market had ended. Yet Grayscale Investments, the world’s largest crypto asset manager, has released a report arguing precisely the opposite. According to Grayscale, this price movement is not only typical but also healthy within a long-term upward trend.
Their analysis asserts that the recent dip is one of several significant corrections historically seen during Bitcoin bull markets. Rather than signaling exhaustion, it mirrors previous mid-cycle resets and suggests that the market is likely building momentum for the next major rally—one that Grayscale believes will culminate in new all-time highs in 2026.
This forward-looking view contrasts with widespread concerns rooted in the long-promoted four-year halving cycle. Grayscale challenges the validity of that model, arguing that recent structural changes—institutional inflows, ETF dominance, and macroeconomic alignment—are reshaping Bitcoin’s market behavior.
1. Grayscale: Bitcoin’s 30% Drop Was Fully Expected
Grayscale’s report categorizes the recent decline as the ninth major correction within the ongoing bull cycle. Since 2010, Bitcoin has experienced over 50 drops greater than 10%, and many bull markets have included multiple 20–30% corrections.
Historically, the average pullback in a bull trend is approximately 30%, making the recent 32% drop nearly identical to long-term norms.
Grayscale emphasizes:
“Such corrections occur every few months in strong bull markets. This price movement does not signal the beginning of a long-term decline.”
Given that Bitcoin had surged aggressively to its October peak—driven by institutional accumulation and ETF demand—the market naturally required a cooling phase. Price discovery in such environments often incorporates rapid expansions followed by equally sharp contractions.
2. Understanding Bitcoin’s Correction Pattern: Healthy Volatility in a Bull Market
Bitcoin’s long-term performance has always been characterized by volatility, yet patterns emerge over extended periods. For example:
- Sharp surges occur as liquidity and speculative demand increase.
- Corrections follow when leverage unwinds or sentiment overheats.
- Consolidation regimes form, establishing new support levels.
- Renewed institutional and retail inflows fuel the next expansion.
Grayscale argues that the current cycle continues to follow this pattern. The absence of a parabolic blow-off rally—a hallmark of previous cycle tops—indicates that the market is still far from euphoric conditions that typically precede multi-year bear markets.
In comparison to earlier eras (e.g., 2013, 2017, 2021), where retail FOMO drove extreme overbought conditions, the current environment demonstrates far more structurally stable demand.
3. Debunking the Four-Year Cycle Myth: Why 2026 May Not Bring a Bear Market
The concept of a predictable four-year cycle has dominated Bitcoin analysis for nearly a decade. This model posits:
- Three years of rising prices
- One year of decline following a halving
- And a repeating rhythm driven by mining economics
However, Grayscale identifies several reasons why this model no longer holds:
3.1 No Speculative Parabolic Surge Has Occurred Yet
Previous cycle tops featured exponential vertical rallies, such as:
- Bitcoin’s rapid ascent from $1,000 → $20,000 in 2017
- The surge from $10,000 → $69,000 in 2021
The current cycle has shown strong growth but nothing remotely comparable.
3.2 Institutions, Not Retail, Now Drive Market Liquidity
Today’s major inflows come from:
- Spot Bitcoin ETFs
- Corporate crypto treasuries
- Institutional macro hedge funds
- Sovereign interest in digital asset strategies
Institutions accumulate more steadily and sell more strategically, reducing the classic retail-driven boom-bust volatility.
3.3 Macro Conditions Favor Bitcoin’s Rise into 2026
Grayscale cites supportive factors including:
- Anticipated U.S. Federal Reserve interest rate cuts
- Continued regulatory clarity across multiple jurisdictions
- Bitcoin’s increasing role as a store of value hedge
These shifts indicate that the structural foundation for Bitcoin demand is stronger than in any previous cycle.
4. Market Structure Evolution: Why Bullish Momentum Is Likely to Continue
Bitcoin’s ecosystem in 2025 differs fundamentally from the markets of 2017 or 2021. Several developments contribute to Grayscale’s confidence:
4.1 Macroeconomic Tailwinds
As inflation cools and central banks prepare for easing cycles, alternative assets such as Bitcoin and gold experience tailwinds due to:
- Lower real yields
- Weaker USD
- Increased appetite for hedging financial uncertainty
4.2 Institutional Entrants Redefine Liquidity Dynamics
Institutional demand enhances:
- Market depth
- Order-book liquidity
- Long-term holding behavior
Notably, spot Bitcoin ETFs now hold millions of BTC collectively, and corporations continue accumulating Bitcoin for treasury diversification.
4.3 Fundamentals Are Stronger Than Market Pricing
Grayscale highlights a divergence:
- Market indices in 2025 have fallen ~8% YTD
- Yet institutional inflows, hash rate, and regulatory clarity have improved substantially
This imbalance suggests significant upside potential once market sentiment recovers.
5. Market Sentiment: Mixed Views Amid Correction and Recovery
5.1 Renewed Price Recovery Ahead of FOMC
Bitcoin dipped briefly below $83,000 in mid-November before recovering toward $92,000 in early December. Investors anticipate the December 10 FOMC meeting, expecting:
- Rate-cut guidance
- A dovish policy pivot
- Favorable conditions for risk-on assets
5.2 Experts Are Divided
Bullish Views
- Arthur Hayes predicts Bitcoin will recover to $200,000–$250,000 by year-end.
- Eric Schiffer expects surging demand once U.S. monetary easing begins.
Bearish Views
- Michael Burry compares Bitcoin’s rise to a modern “tulip mania,” arguing it lacks intrinsic value.
5.3 Long-Term Structural Strength Remains Unchanged
While short-term sentiment varies, structural elements—ETF inflows, corporate adoption, macroeconomic alignment—point toward an extended upward phase continuing into 2026.
Conclusion: Fear Creates Opportunity—2026 May Define Bitcoin’s Next Milestone
Grayscale’s analysis suggests that the recent decline is not a warning but a signal of typical market behavior during a bull cycle. The evidence points strongly to continued institutional accumulation, macroeconomic support, and a maturing market structure capable of sustaining higher valuations.
The prediction:
Bitcoin is likely to reach new all-time highs in 2026, potentially surpassing $200,000–$250,000.
For investors seeking:
- New crypto assets
- Additional revenue streams
- Practical blockchain applications
…the coming years may provide some of the most significant opportunities since Bitcoin’s inception.
As Robert Kiyosaki famously noted:
“True wealth is born during times of fear.”
The current correction may be exactly that moment.
