Main Points:
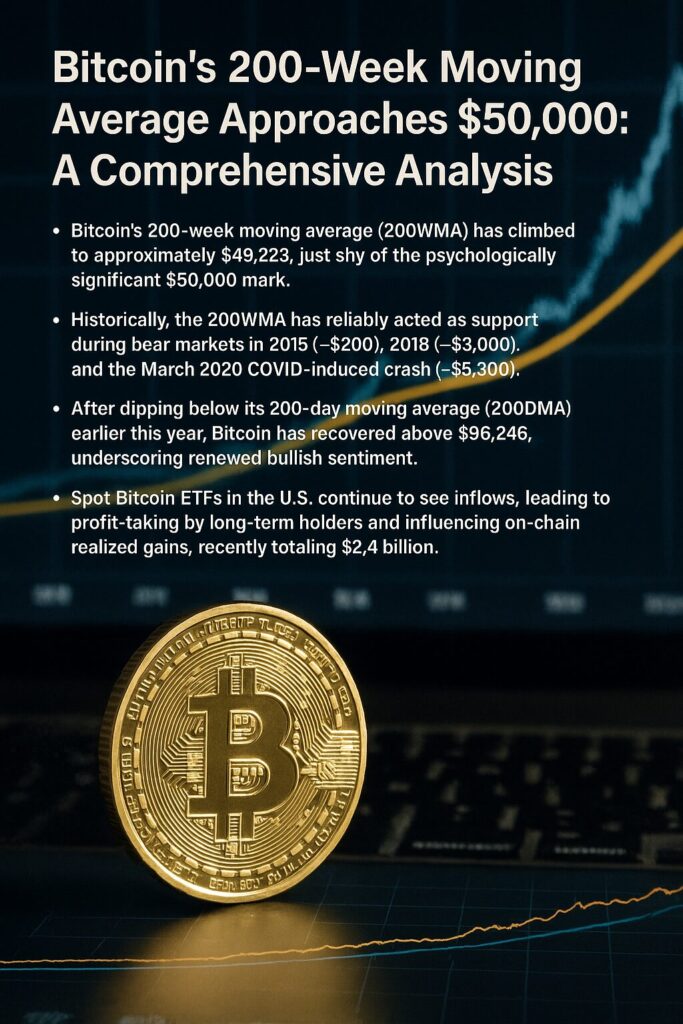
- Bitcoin’s 200-week moving average (200WMA) has climbed to approximately $49,223, just shy of the psychologically significant $50,000 mark.
- Historically, the 200WMA has reliably acted as support during bear markets in 2015 (~$200), 2018 (~$3,000), and the March 2020 COVID-induced crash (~$5,300).
- After dipping below its 200-day moving average (200DMA) earlier this year, Bitcoin has recovered above $96,246, underscoring renewed bullish sentiment.
- Spot Bitcoin ETFs in the U.S. continue to see inflows, leading to profit-taking by long-term holders and influencing on-chain realized gains, recently totaling $2.4 billion.
- With the Nasdaq 100 and S&P 500 both posting record highs amid easing inflation, broader market momentum may catalyze Bitcoin’s next breakout.
Historical Significance of the 200-Week Moving Average
The 200-week simple moving average (200WMA) is one of the few indicators that has consistently risen over time for Bitcoin and has marked critical turning points across multiple four-year cycles. In 2015’s bear market, it provided a floor around $200 before Bitcoin rebounded. During 2018’s downturn, it hovered near $3,000 and again formed a strong support base. When the COVID-19 pandemic triggered a sharp sell-off in March 2020, Bitcoin briefly dipped below the 200WMA to around $5,300 but recovered to close its drawdown at approximately $3,000, demonstrating the moving average’s role as a safety net for longer-term holders.
These historical patterns suggest that as Bitcoin’s 200WMA pushes toward $50,000, it may signal another pivotal support level that could underpin the next leg of a multi-year bull run.
Recent Market Dynamics: Price Recovery and Volatility
Bitcoin’s spot price, which traded as low as $100,000 in mid-May amid geopolitical tensions between Iran and the U.S., has since recovered to trade near $106,300 as of July 1, 2025. The rebound above the 200DMA—currently $96,246—underscores renewed bullish conviction, with Bitcoin outperforming many altcoins and showing resilience against risk-off moves in tech stocks.
At the same time, long-term holders have realized profits totaling $2.4 billion over the past week, marking the highest seven-day realized gains since May and reflecting significant portfolio rebalancing in response to ETF inflows. This dynamic interplay between profit-taking and ETF demand will likely shape short-term volatility.
Chart: Bitcoin 200-Week Moving Average Over Key Market Cycles
Below is a visualization of the 200WMA across key years, highlighting its gradual ascent and critical support levels:
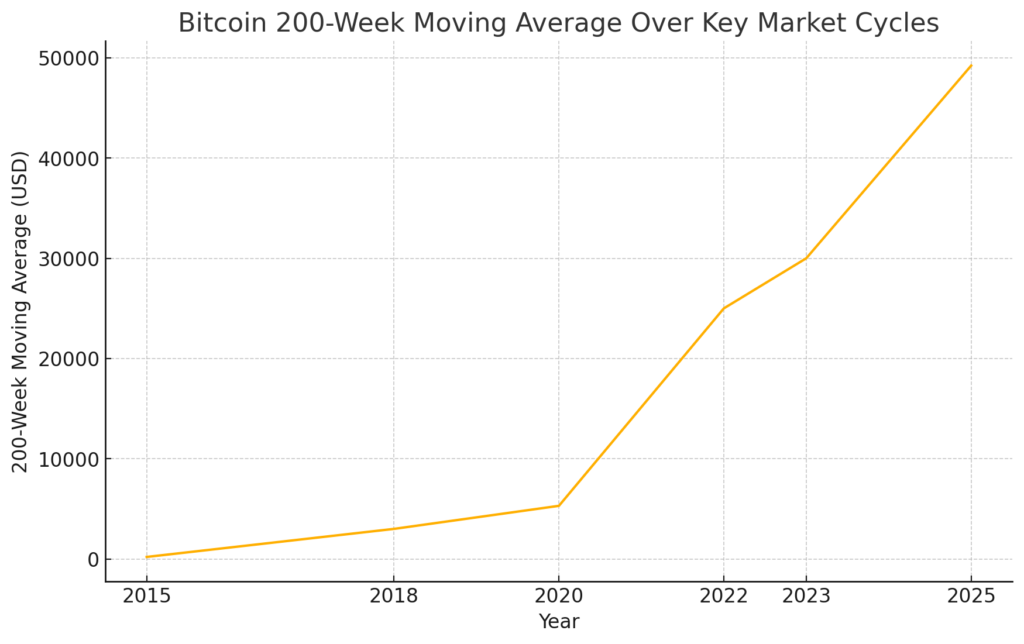
Trading above both moving averages is often considered a hallmark of bull markets, and their convergence suggests that institutional and retail interest may be coalescing to support higher price floors.
Broader Market Context: Equities and Macroeconomic Catalysts
As of July 1, 2025, both the Nasdaq 100 and S&P 500 have reached all-time highs, bolstered by easing U.S. Core PCE inflation data and dovish commentary from Federal Reserve officials. With this favorable macro backdrop, allocators increasingly view Bitcoin as a diversifier or “digital gold,” integrating it more closely with traditional risk assets—a trend documented in recent academic research showing a correlation peak of 0.87 between Bitcoin and U.S. equity indices in 2024.
Emerging catalysts such as potential Fed rate cuts, legislative progress on U.S. crypto regulation, and evolving ETF structures could further accelerate inflows. However, investors should remain mindful of profit-taking pressures and periodic volatility as on-chain metrics fluctuate.
Practical Implications for Crypto Investors
- Support-Based Entry Strategies: With the 200WMA approaching $50,000, drip-feed buying near this long-term support could mitigate downside risk.
- ETF-Driven Volatility: Monitor net inflows into U.S. spot Bitcoin ETFs, as spikes often precede periods of realized gains and short-term retracements.
- Portfolio Diversification: Consider correlation dynamics—Bitcoin’s increasing synchronicity with equities may enhance portfolio efficiency but can also heighten drawdown risks during systemic shocks.
- Emerging Use Cases: Keep an eye on blockchain applications such as Lightning Network payments and DeFi integrations that may underpin Bitcoin’s utility beyond store-of-value narratives.
Conclusion
Bitcoin’s 200-week moving average nearing $50,000 underscores a pivotal juncture in its multi-year bull cycle. Historical precedent suggests that this milestone can serve as a durable support, providing confidence to long-term holders and new entrants alike. Coupled with a robust recovery above the 200-day moving average, record highs in U.S. equity markets, and continued ETF-driven flows, the technical and macro fundamentals align for a potentially sustained rally. For investors seeking fresh crypto-asset opportunities and practical applications of blockchain technology, a strategically timed approach around these moving averages may offer an optimal risk-reward profile.
