Main points :
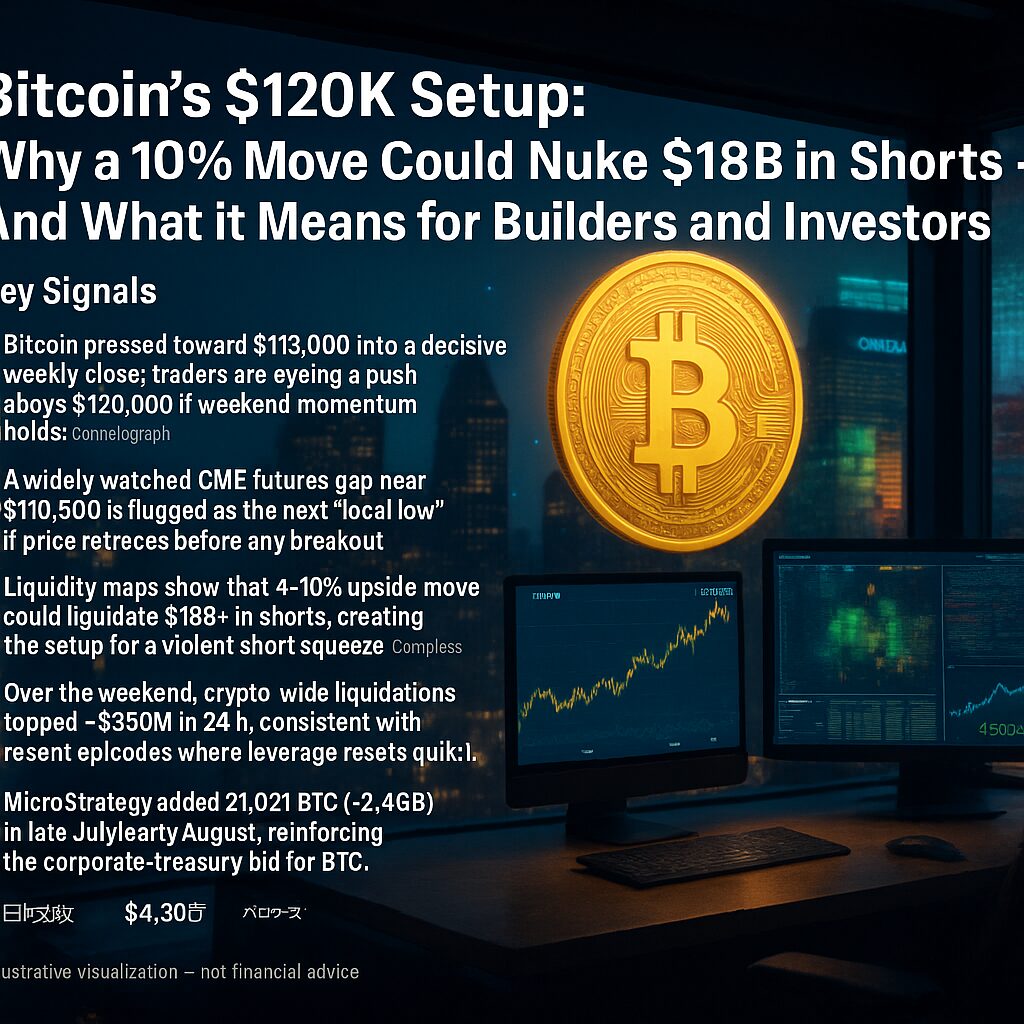
- Bitcoin pressed toward $119,000 into a decisive weekly close; traders are eyeing a push above $120,000 if weekend momentum holds.
- A widely watched CME futures gap near $116,500 is flagged as the next “local low” if price retraces before any breakout.
- Liquidity maps show that a ~10% upside move could liquidate $18B+ in shorts, creating the setup for a violent short squeeze.
- Over the weekend, crypto-wide liquidations topped ~$350M in 24h, consistent with recent episodes where leverage resets quickly.
- Spot Bitcoin ETF flows have turned positive again on several recent sessions (e.g., $91.5M on Aug 6, $226.6M on Aug 7, $404M on Aug 8), signaling returning institutional demand.
- MicroStrategy added 21,021 BTC (~$2.46B) in late July/early August, reinforcing the corporate-treasury bid for BTC.
- ETH has printed multi-year highs above $4,300, complicating the BTC/ETH rotation but adding tailwinds to broader crypto liquidity.
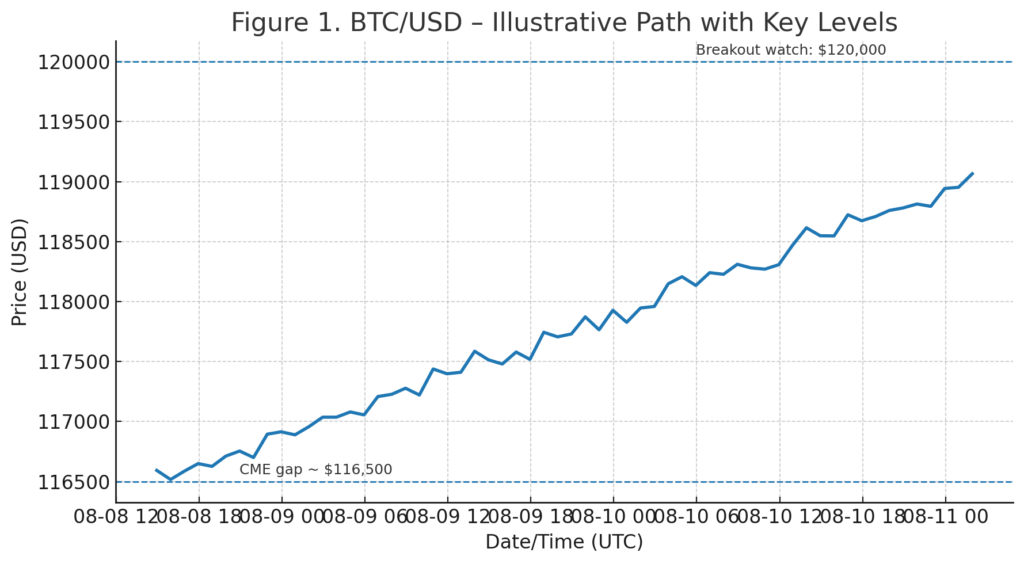
[Insert Figure 1 here: “BTC/USD – Illustrative Path with Key Levels” showing 116,500 gap and 120,000 breakout]
Market Snapshot: A Weekend Push Toward $119K
Bitcoin (BTC) ground higher into the Sunday weekly close, tagging the high-$118Ks on major spot venues and flirting with a clean break of the psychologically crucial $120,000 level. In the near term, traders describe the setup as binary: either a quick retrace to absorb liquidity around the CME gap (~$116,500) or a fast continuation through $120K that could force broad short covering.
Behind the scenes, derivatives metrics and liquidation heatmaps show fragile short positioning in the $118K–$120K area. That fragility is why a relatively modest ~10% upside could, according to trader estimates, flush $18B+ of leveraged shorts — the kind of fuel that turns orderly trend days into vertical moves.
The Short-Squeeze Math: Why $18B Matters
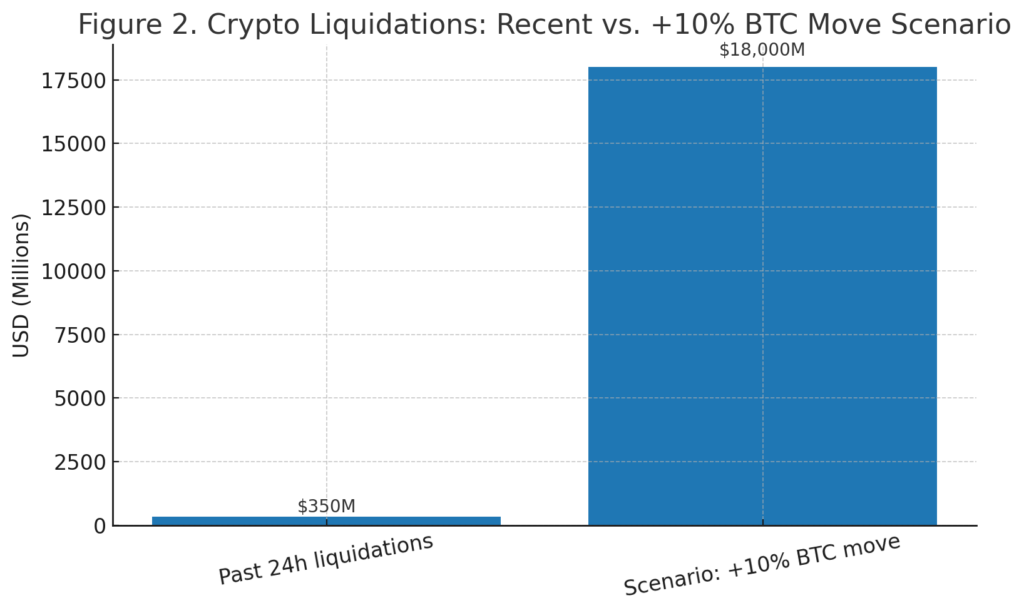
Liquidations don’t require a black swan — they often start with a nudge where price hits stacked stop zones. Here, the nudge is the $120K round number coupled with visible short interest above current price. If the tape clears that shelf with momentum, algorithmic de-risking forces shorts to buy back at increasingly worse prices. That feedback loop can turn a 2–3% advance into a cascading 8–10% squeeze, especially on a Sunday/Monday handoff when TradFi desks reopen and basis/funding recalibrate. The weekend just illustrated the leverage sensitivity again: ~$350M was liquidated across crypto in 24 hours, even before a decisive breakout.
To visualize scale, compare recent realized liquidations with a potential squeeze scenario:
[Insert Figure 2 here: “Crypto Liquidations — Recent vs. +10% BTC Move Scenario”]
The CME Gap Magnet at $116,500
Futures markets closed Friday with a gap in CME Bitcoin futures around $116,500, and spot action early this week already flirted with filling prior gaps in that zone. Market technicians watch these levels because BTC has a statistical habit of revisiting untraded ranges on CME when new liquidity appears. In this tape, that area is a natural “retest or reload” candidate before any assault on $120K+.
The tactical takeaway: if BTC slips into the $116K–$117K pocket, it doesn’t necessarily invalidate the uptrend — it may simply satisfy the market’s tendency to “fill and go” before the next leg. Conversely, a clean break and hold above $120K would indicate that the market prioritized momentum over mean-reversion. Recent liquidity maps show offers thickening $117.5K–$118K and bids extending below $114K around a now-filled gap, capturing this push-pull perfectly.
[Insert Figure 1 again if needed near here for narrative continuity.]
Flows & Fundamentals: Institutions Are Still in the Room
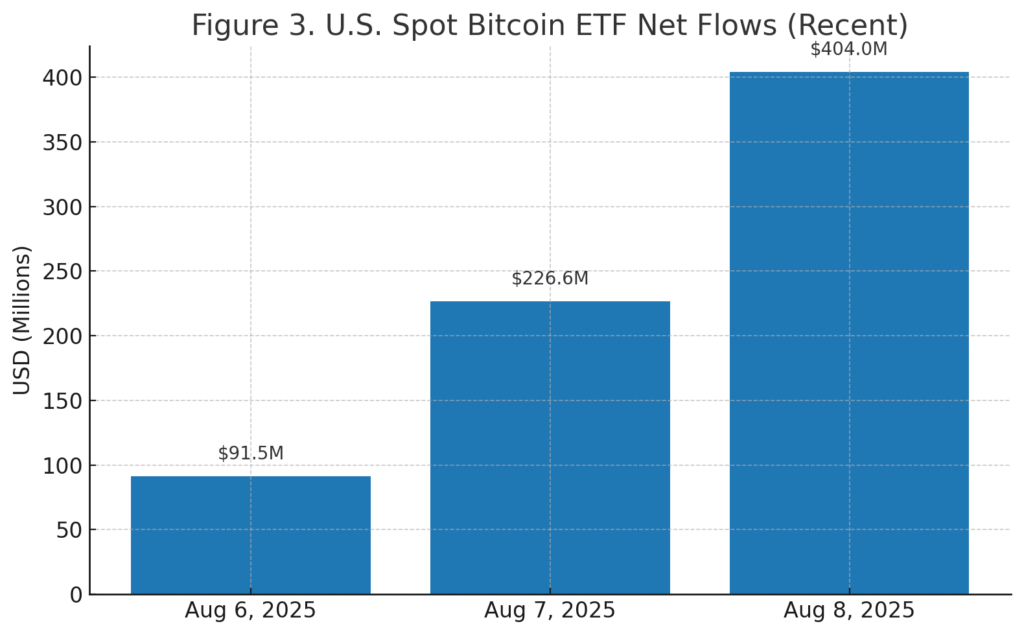
Even as crypto rotates between narratives, spot ETF flow prints help frame underlying demand. After a mid-July wobble (a $131M net outflow day ended a 12-day inflow streak), U.S. spot BTC ETFs snapped back to net inflows on multiple recent sessions: +$91.5M (Aug 6), +$226.6M (Aug 7), and +$404M (Aug 8). This rhythm — outflows on profit-taking, followed by sharp inflow rebounds — is consistent with a maturing investor base using ETFs to scale exposure.
[Insert Figure 3 here: “U.S. Spot Bitcoin ETF Net Flows (Recent)”]
On the corporate front, MicroStrategy disclosed a fresh 21,021 BTC purchase (approx. $2.46B, or ~$117,256 per BTC) between July 28 and Aug 3, taking reported holdings to ~628,791 BTC. Regardless of one’s view on leverage and equity issuance, that magnitude of treasury demand provides a floor-building effect on drawdowns and a reflexive bid on breakouts.
The ETH Wildcard: Rotation Risks and Opportunities
The weekend didn’t belong solely to Bitcoin: ETH broke above $4,300, a multi-year high, stirring classic rotation debates (does ETH strength help or hinder BTC’s path through $120K?). Historically, strong ETH legs can tighten spreads, lift alt liquidity, and increase risk appetite, which indirectly aids BTC during trend phases — but they also compete for marginal dollars in the near term. Analysts are already floating $6K–$20K scenarios for ETH over the next cycle if momentum persists.
For Investors: Three Playbooks for the Next 1–3 Weeks
1) Breakout-and-Run
If BTC sails through $120K on expanding spot volumes and stable funding, trend followers typically add on retests of $120K–$121K with tight invalidation just below. Watch basis/funding: a surge to stretched positive funding without corresponding spot inflows increases blow-off risk. ETF prints remaining net-positive for several days would support this path.
2) Fill-and-Go
A dip into $116K–$117K that quickly reclaims $118K suggests the market satisfied the CME magnet and is now free to target $120K+. Historically, these moves tend to be fast; staggered bids and pre-defined invalidation levels help manage slippage.
3) Deeper Mean-Reversion
Failure to hold the mid-$116Ks, combined with renewed ETF outflows and softening macro risk, opens room toward prior demand pools below $114K. In that case, patience and capital preservation beat hero trades. Liquidity heatmaps imply the market will gravitate toward the thickest resting liquidity, for better or worse.
For Builders and Operators: Where the Rubber Meets the Road
- Payments rails & on-ramps: Persistent ETF demand plus corporate treasury adoption (e.g., MicroStrategy) keep fiat↔BTC rails busy. If you operate a wallet/exchange, prioritize instant USD settlement, travel-rule-compliant flow, and smart routing to minimize slippage during squeezes.
- Treasury & treasury-like services: With BTC above six figures, automated DCA + treasury-hedging products (e.g., covered call overlays) appeal to corporates and DAOs seeking yield with guardrails.
- Market infrastructure: Volatility clusters around gaps and round numbers — ensure circuit breakers, dynamic margin, and latency-aware risk checks. If you clear client orders, rehearse “liquidity air-pocket” playbooks before Monday opens.
- Data & risk analytics: Surface heatmap-derived liquidation zones and ETF flow dashboards directly in trader UI so clients can connect flow → price in real time.
What Could Go Right (and Wrong)
Bullish path: A print and hold above $120K triggers a mechanical short squeeze, ETF inflows remain net positive, and macro stays cooperative. That triad typically extends trend legs and invites new ATH chatter.
Bearish path: BTC rejects $120K, reverts to fill the $116.5K gap, ETF prints cool, and ETH rotation siphons off risk capital. In that case, price can chop until the next data-driven catalyst.
Conclusion
Bitcoin’s weekend grind toward $119K set the board for a classic squeeze-or-fill decision. The $116,500 CME gap is the gravity well below; $120,000 is the trapdoor above. Meanwhile, ETF flows flickered back to green and corporate treasuries are still adding coin — both supportive for dips and potent during breakouts. Whether you trade, invest, or build, the near-term edge lies in planning both paths in advance: respect the gap, respect the squeeze, and let flow confirm the narrative.
