Key Points :
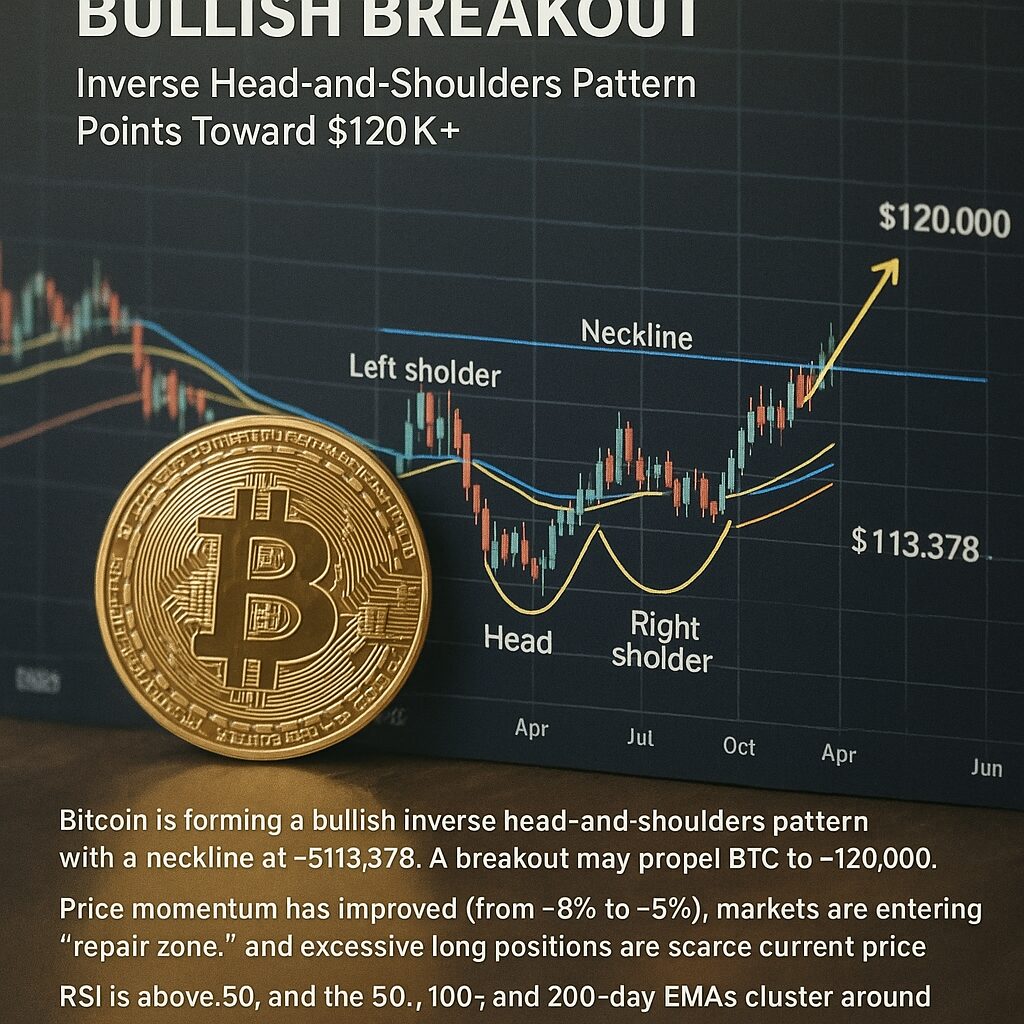
- Bitcoin is forming a bullish inverse head-and-shoulders pattern with a neckline at ~$113,378. A breakout may propel BTC to ~$120,000.
- Price momentum has improved (from –8% to –5%), markets are entering a “repair zone,” and excessive long positions are scarce.
- RSI is above 50, and the 50-, 100-, and 200-day EMAs cluster around current price, offering potential technical support.
- If BTC clears ~$113K, a parallel bullish scenario suggests moving toward $127K; failure below ~$107K would invalidate the pattern.
- Institutional accumulations—e.g., MicroStrategy’s recent ~$217M purchase—and expanding ETF assets lend confidence to market structure.
1. Technical Setup: Inverse Head-and-Shoulders Emerges
Bitcoin’s price action has been hinting at a potentially game-changing shift: the formation of an inverse head-and-shoulders (I-H&S) pattern—a classic bullish reversal setup. On short-duration charts, the left shoulder, head, and right shoulder are forming, with a robust neckline overhead at roughly $113,378. A decisive breakout above that level could trigger a powerful rally upward toward $120,000.
Simultaneously, on the 4-hour timeframe, the structure mirrors this setup, with a key resistance line around $113,650. A daily close above this could mark the first return of bullish structure in Q3 and potentially catalyze renewed buying momentum.
2. Shifting Sentiment: Momentum Easing into Repair Zone
Momentum indicators reveal a quiet shift: weekly momentum improved from a sharp –8% downtrend to a milder –5%, suggesting that selling pressure is ebbing and the market could be entering a “repair zone”—a period often preceding strong moves.
Meanwhile, futures traders appear cautious—open interest is flat, and the Integrated Market Index has stabilized near neutral, signaling reduced speculative bias in the near term. Historically, such periods of defensive positioning and deleveraging often lay the groundwork for breakout rallies.
3. Supporting Technical Indicators: RSI and Moving Averages Align
Momentum oscillators and moving averages bolster the bullish argument:
- RSI (Relative Strength Index) is stabilizing above 50—typically viewed as the threshold where bullish sentiment starts to return.
- On the longer timeframes, 50-day, 100-day, and 200-day EMAs are converging near the current price, poised to switch from resistance to support if price sustains above.
These technical clusters can reinforce investor confidence and attract short-term buyers, underpinning upward moves.
4. Alternative Bullish Scenario: Targeting ~$127K if Break Holds
Another technical angle emerges if BTC clears the ~$113K neckline. Analysts point out the simultaneous formation of both a double-bottom and an inverse H&S, sharing the same neckline. If price holds above that level, the target could stretch to $127,000—calculated via traditional technical projection methods (distance from the head to the neckline added upward).
This scenario, though less widely discussed, aligns with the broader narrative of a coalescing bullish structure across multiple time frames.
5. Risk Management: Downside Risks and Pattern Invalidations
Of course, no pattern guarantees success. The bullish I-H&S pattern would be invalidated if Bitcoin falls below around $107,300, shifting focus to support near the 200-day simple moving average (~$101,850).
Traders often place stop losses just below the right shoulder of an inverse pattern, managing downside risk while targeting upward movement—consistent with established pattern trading tactics.
6. Institutional Demand and ETF Momentum Backing the Setup
Beyond charts, strong underlying demand is emerging:
- MicroStrategy (led by Michael Saylor) recently acquired 1,955 BTC (~$217.4 million) between September 2–7, bringing its total holdings to 638,460 BTC.
- “Whales” have accumulated over 65,000 BTC (~$7.3 billion) in the past month, demonstrating conviction among large holders.
- Spot Bitcoin ETFs continue to attract investor interest, with assets under management approaching those of gold ETFs (~$160 billion vs. ~$180 billion), enhancing institutional comfort and liquidity in the crypto ecosystem.
This combination of technical setup and underlying demand forms a compelling backdrop for the bullish thesis.
7. Visual Aids (Graph/Figure)
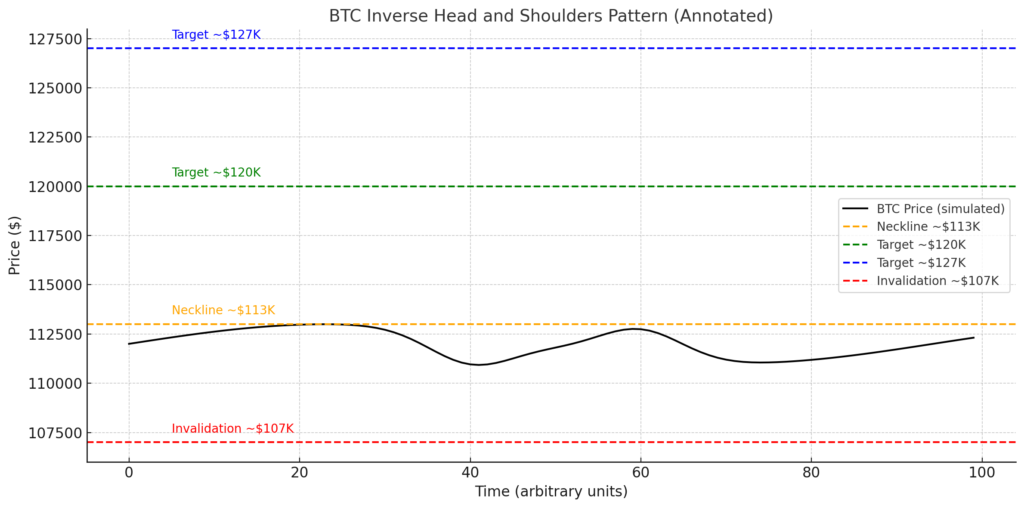
An annotated BTC inverse H&S pattern, highlighting neckline ($113K), target ($120K or $127K), and failure zone (~$107K).
Conclusion: Preparing for the Next Leg Up?
Bitcoin appears to be coiling for a significant move. A well-defined inverse head-and-shoulders formation—supported by improving momentum, RSI above 50, and clustered EMAs—sets the stage for a breakout above $113K, potentially targeting $120K or even $127K under certain setups.
Combined with reduced leverage, defensive market positioning, and strong institutional accumulation (MicroStrategy, whales, ETF inflows), this could mark the earliest inflection point toward the next bull phase.
However, traders should monitor $107K as a critical invalidation threshold and use prudent risk management (e.g., stop-loss below the right shoulder). As BTC hovers at this crossroads, opportunity aligns with caution—making now a defining moment for positioning in the crypto space.
