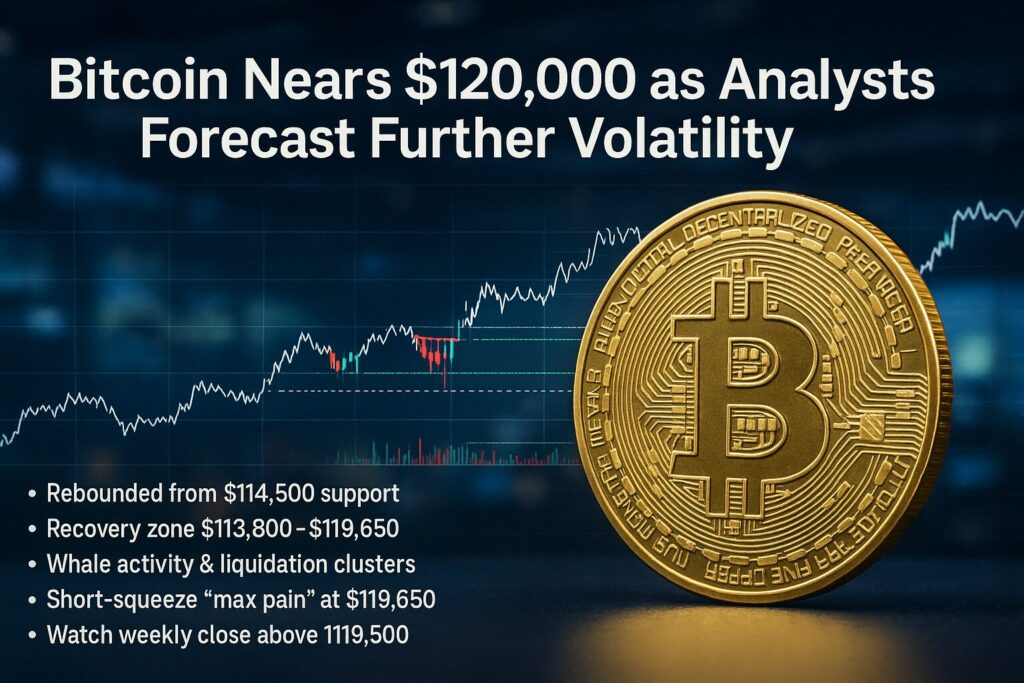
Key Points:
- Bitcoin rebounded strongly from $114,500 support to challenge $120,000 resistance.
- Multiple analysts highlight key recovery and liquidation zones around $113,800–$119,650.
- Whale activity and concentrated liquidation clusters suggest heightened volatility ahead.
- Short-squeeze “max pain” sits near $119,650, with potential $1.1 billion+ in liquidations.
- Traders should watch weekly close above $119,500 to confirm renewed uptrend.
1. Resilient Week-Long Price Rebound
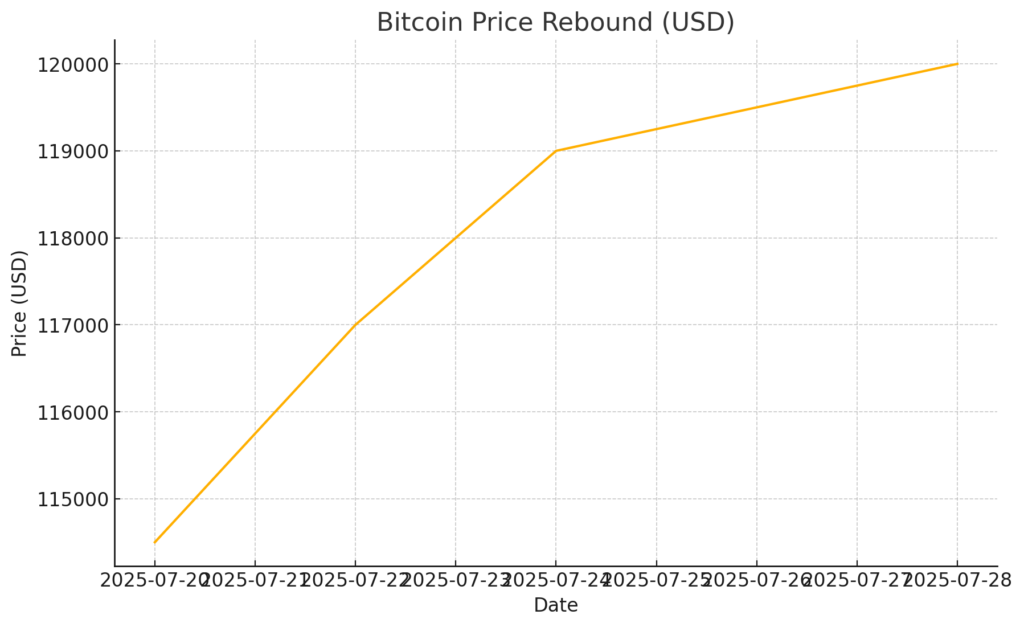
Bitcoin (BTC) staged a pronounced recovery over the past week, climbing from a two-week low near $114,500 to trade just under $120,000 at the time of writing. The rebound began after BTC/USD comfortably held above its 10-day simple moving average (SMA) on the daily close, a critical technical milestone signaling renewed buyer interest. Market sentiment was buoyed by reports of the U.S. and China agreeing to delay new reciprocal tariffs, easing macro headwinds and driving risk-on flows back into crypto markets.
[Insert Figure 1: Bitcoin Price Rebound Chart Here; see]
2. Resistance and Support Levels Under Scrutiny
Prominent trader Ted Pillows noted on X that BTC must close weekly above $119,500 to avoid an extended consolidation. Failing that, the current range between $114,500 and $119,500 may persist. Meanwhile, Rekt Capital pointed out that reclaiming the lower bound of the broader ~$100,000–$120,000 range on the daily chart was the first step toward full recovery. A successful retest of that lower bound would validate bulls and likely pave the way to fresh highs above $120,000.
3. Whale Activity & Liquidation Clusters
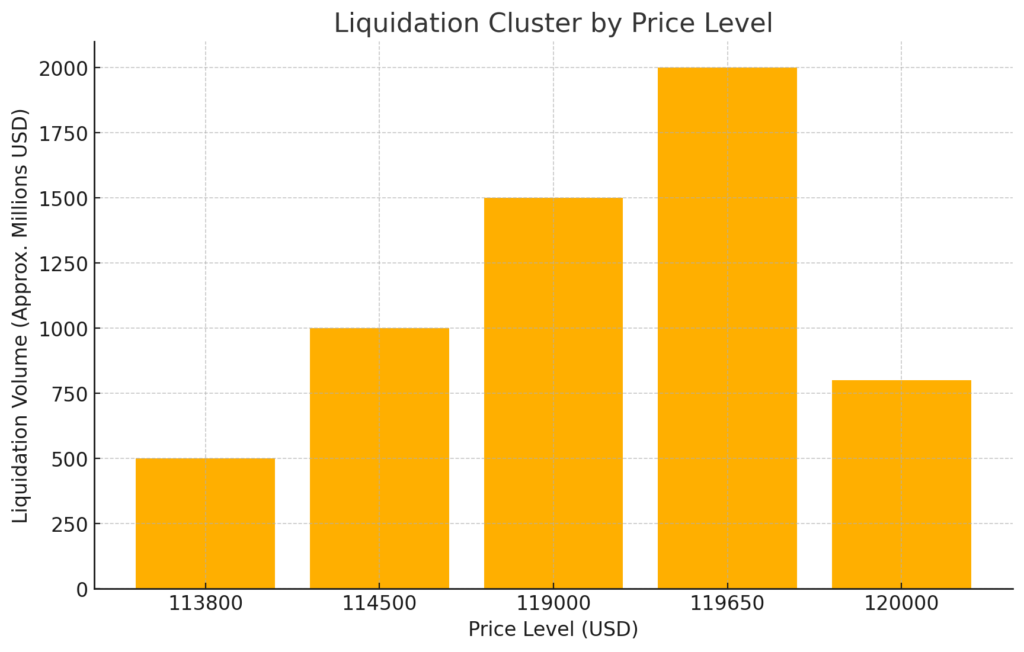
Data from CoinGlass indicates that the “max pain” point for BTC short positions sits at $119,650, where forced liquidations could exceed $1.1 billion. Further, order book analyses show dense clusters of stop-loss and liquidation orders between $114,500 and $113,800, representing natural downside targets if bulls fail. These clusters act as magnet zones, meaning any break below short-term support could trigger cascading sell orders.
[Insert Figure 2: Liquidation Cluster Bar Chart Here; see]
4. Anticipated Surge in Volatility
On-chain monitoring service Coinank highlighted resistance densification around $119,000–$120,000, suggesting stiff headwinds ahead. Additionally, TheKingfisher’s GEX+ chart shows dealers heavily short gamma, meaning market makers may widen implied volatility to hedge. Such positioning typically precedes sharp price swings, with both upside and downside moves amplified as participants adjust.
5. Implications for Traders & Investors
Given the stacked liquidation levels and technical thresholds, traders should:
- Monitor Weekly Close: A weekly close above $119,500 would signal bullish breakout potential.
- Set Protective Stops: Place stops below $113,800 to guard against cluster-triggered drops.
- Plan Entries: Consider scaling in near strong support (~$114,500) for lower-risk entries.
- Watch Volatility Indicators: Rising implied vol suggests rapid moves; avoid oversized positions.
Conclusion
Bitcoin’s surge from $114,500 to near $120,000 underscores robust demand and the critical influence of macro-news on crypto flows. However, concentrated liquidation zones and dealer gamma positioning point to heightened volatility ahead. A decisive weekly close above $119,500 could ignite the next leg up, while failure may trap BTC in its current range. Traders and investors alike should calibrate risk, leverage technical support/resistance, and prepare for sharp swings in both directions.
