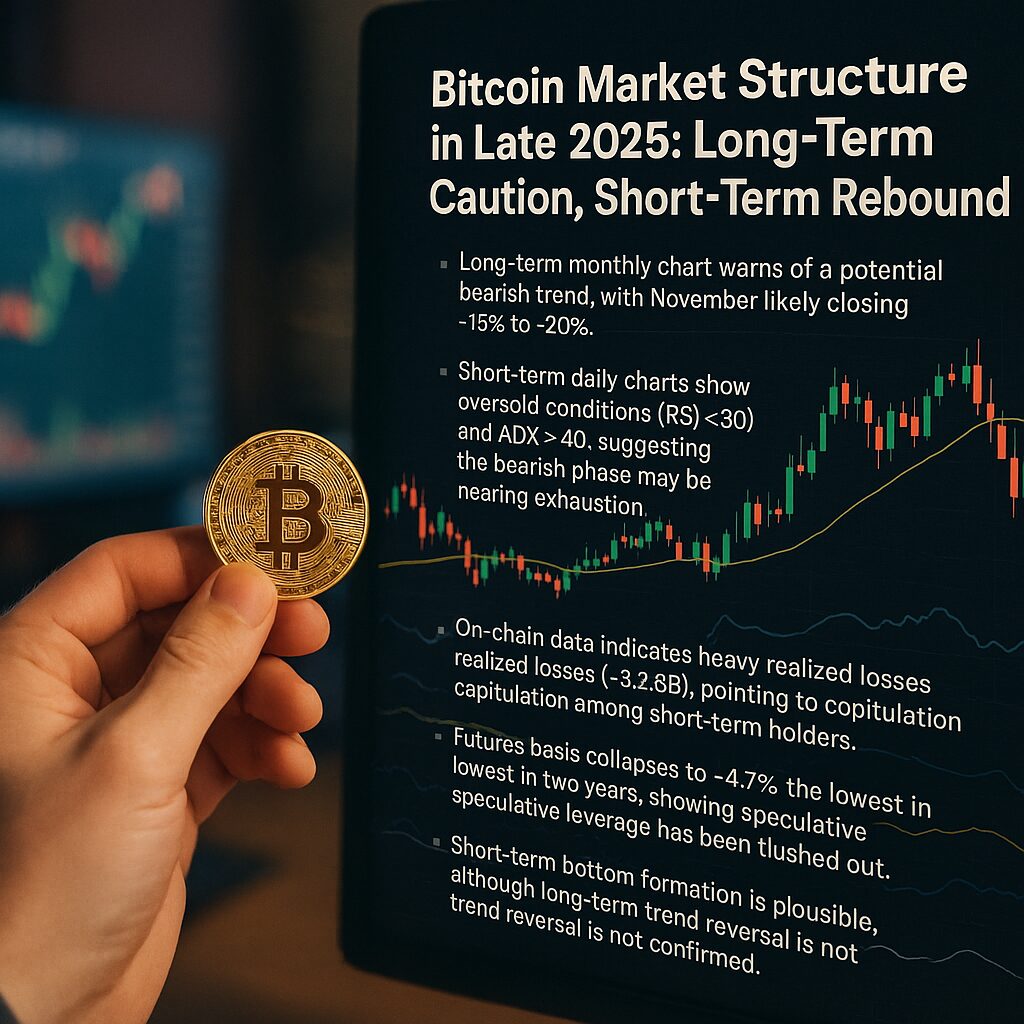
Main Points :
- Long-term monthly chart warns of a potential bearish trend, with November likely closing −15% to −20%.
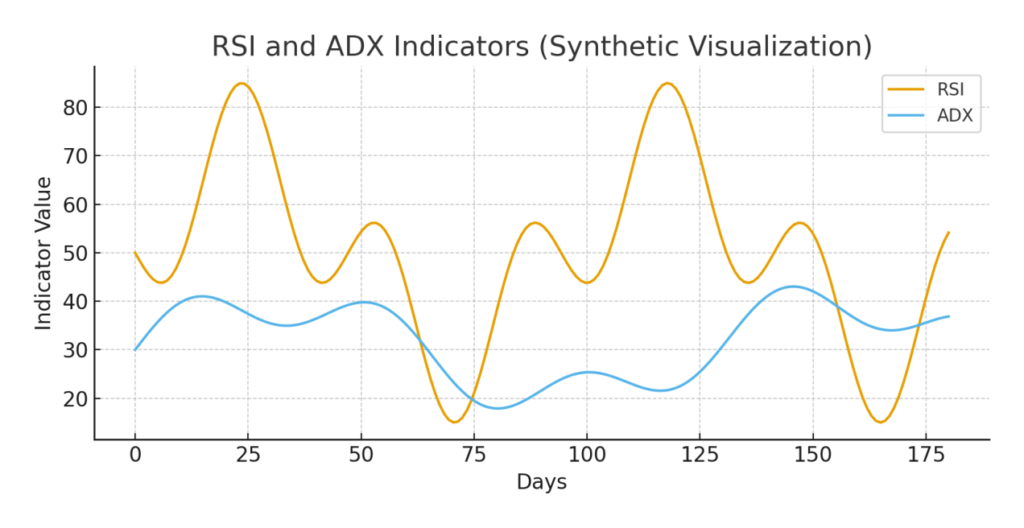
- Short-term daily charts show oversold conditions (RSI < 30) and ADX > 40, suggesting the bearish phase may be nearing exhaustion.
- On-chain data indicates heavy realized losses (~$2.8B), pointing to capitulation among short-term holders.
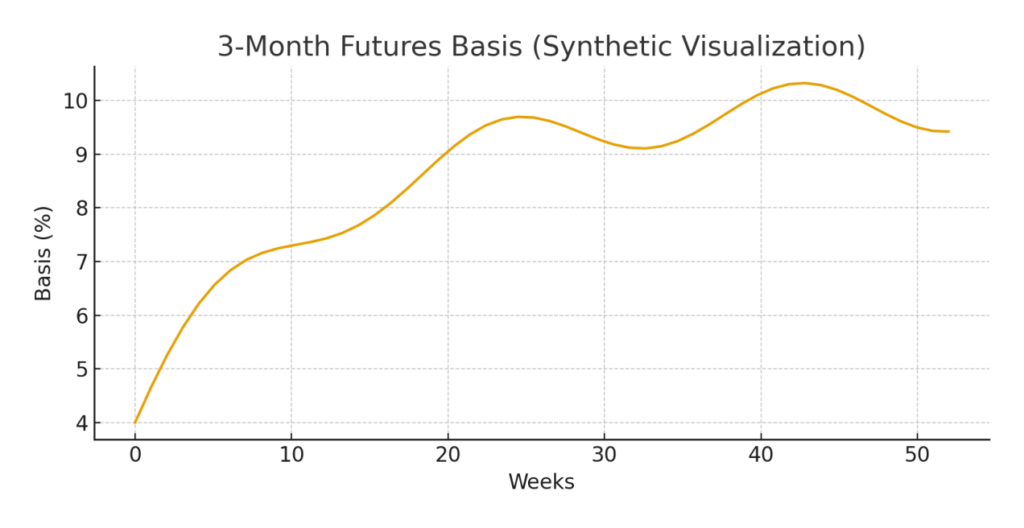
- Futures basis collapses to ~4.7%, the lowest in two years, showing speculative leverage has been flushed out.
- Short-term bottom formation is plausible, although long-term trend reversal is not confirmed.
1. Introduction — Bitcoin at a Critical Technical Crossroads
Bitcoin’s price structure in late 2025 presents a fascinating contradiction: while long-term charts warn of the start of a broader downtrend, short-term price action and on-chain dynamics show conditions typical of market bottoms. November’s sharp decline of roughly 15%–20% shows the market’s vulnerability after setting new highs earlier this year.
However, oversold indicators, rapid position cleansing, reduced speculative leverage, and on-chain capitulation signals suggest that the sell-off may be approaching exhaustion—opening the door for a short-term rebound.
This article synthesizes the Bitbank technical analysis with other market insights as of late November 2025, integrating on-chain, futures, and sentiment indicators to guide investors seeking new opportunities and practical blockchain asset strategies.
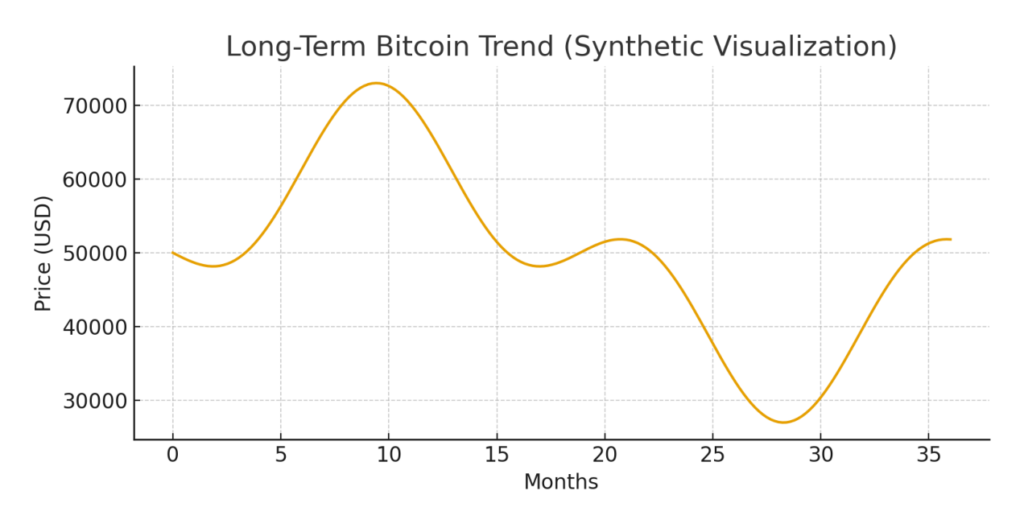
2. Monthly Chart — Long-Term Trend Flashes Caution
A Bearish Monthly Candle After a Doji Warning
November’s monthly candle is poised to close with a significant −15% to −20% decline. This is unusual given that historically, November has tended to be a strong month for Bitcoin.
Last month’s Doji candle following an all-time high was an early signal that buying demand was weakening.
Now, price has failed to break below the yearly low near ¥12,000,000 (~$78,000), but the structure has turned fragile:
- Momentum behind the prior uptrend has dissipated
- Buyers are no longer stepping in aggressively at prior breakout points
- Monthly structure resembles early-stage downturns seen in prior cycles
3. Weekly Chart — Breakdown and Sharp Oversold Rebound
Support Failure Leads to Accelerated Selling
In the first week of November, Bitcoin attempted to defend the ¥15,000,000 (~$97,500) level. However, by the second week, price broke decisively below the support line, triggering an acceleration of sell orders.
During the third week, BTC briefly dipped below ¥13,000,000 (~$84,500), but strong buying from oversold conditions resulted in a wick formation on the weekly candle.
This pattern historically appears during:
- Capitulation events
- Trend exhaustion phases
- Liquidity flushes before bottom formation
While this does not confirm a new uptrend, it provides evidence that forced selling may have peaked.
4. Daily Chart — Oversold Conditions Suggest Short-Term Bottom
BTC Spends Most of the Month Below the 14-day EMA
Bitcoin has traded below the 14-day EMA for nearly the entire month, and each attempt to retest the average resulted in renewed selling pressure.
However, the final week of November has seen price reclaim the ¥14,000,000 (~$91,000) range and retest the moving average again. Short-term indicators suggest a possible shift:
- ADX surpassing 40 indicates the bearish trend is mature
- RSI dipping below 30 marks the second oversold reading this year
- Historic behavior: RSI < 30 often precedes 2–6 week relief rallies
Thus, the daily chart is at a level where a trend reversal frequently occurs—especially when combined with on-chain capitulation data.
5. On-Chain Evidence — Capitulation and Position Reset
$2.8B in Realized Losses in a Single Week
According to Glassnode’s loss-based transfer metrics, Bitcoin saw roughly $2.8 billion worth of coins moved at a loss—the highest in two years.
Notably, this exceeds levels recorded during:
- The February 2025 “Trump Tariff Shock” decline
- The 2022 bear market capitulation zone (~$2.4B realized losses)
This suggests that:
- Short-term holders have been flushed out
- High-cost positions were forcibly liquidated
- Market structure has reset to a healthier foundation
Long-Term Holders Still in Profit
Glassnode’s analysis of profitable addresses shows that roughly 80% of long-term holders remain in the green, even after the decline. This has two implications:
- Selling pressure comes mostly from short-term holders, not long-term believers.
- Long-term holders tend to accumulate at undervalued ranges—supportive of a bottoming environment.
The combination of short-term capitulation and long-term holder stability has historically preceded significant mid-term rebounds.
6. Futures Market — Speculative Leverage Evaporates
3-Month Futures Basis Drops to ~4.7%
The difference between spot and 3-month futures prices—known as the basis—is hovering around 4.7%, with intraday touches in the 3% range. This is the lowest level in two years.
Earlier this year, the basis was around 13%, signaling heavy speculative buying. The decline to under 5% now indicates:
- Leverage has been flushed out
- Speculative long positions have been closed
- Market is back to a more neutral structure
This shift reduces the risk of cascade liquidations and opens the path for a more stable short-term recovery.
7. Recent Market Developments to Consider (Late 2025)
ETF Flows Have Stabilized
U.S. Bitcoin spot ETFs, which were a major driver of early-year strength, have seen neutral-to-slightly-negative net inflows in Q4 2025. However, outflows have slowed significantly in late November—coinciding with the oversold bounce.
Macro Conditions Are Mixed
- The U.S. Federal Reserve paused rate cuts due to stickier inflation
- Japan’s monetary policy shift strengthened the yen
- Geopolitical uncertainties (U.S. tariff policy, Middle East tensions) introduced volatility
These macro elements contribute to reduced risk appetite but have not triggered systemic crypto selling.
Institutional Derivatives Activity Cooling
CME open interest dropped by nearly 20% from the peak, consistent with a deleveraging environment.
8. Short-Term vs. Long-Term Outlook
Short-Term (1–6 Weeks): Bullish Bias
- Oversold RSI
- ADX exhaustion
- On-chain capitulation
- Futures basis reset
All suggest a strong probability of a relief rally, likely retesting ¥15,000,000 (~$97,500).
Medium-Term (1–3 Months): Neutral
A trend reversal is not yet confirmed. BTC must reclaim the monthly support-resistance flip near ¥16,000,000 (~$104,000).
Long-Term (6–12 Months): Caution
Monthly structural weakness implies that Bitcoin may enter a slower, grinding downtrend similar to the mid-cycle periods in 2019 and 2021.
9. Conclusion — A Market Cleansing That Sets Up Opportunity
Bitcoin’s late-2025 technical environment presents a rare double-sided scenario:
- Long-term charts warn that caution is necessary, as the broader uptrend may be losing momentum.
- Short-term and on-chain signals strongly indicate bottoming behavior, suggesting attractive opportunities for strategic entry.
For investors seeking new crypto assets, yield opportunities, or practical blockchain use cases, short-term accumulation—especially during deeply oversold conditions—remains historically profitable. However, long-term trend confirmation will require sustained recovery above major monthly resistance levels.
