Main Points :
- Bitcoin’s current pullback is being widely debated as either a cycle top or a healthy correction.
- Macro indicators such as the Copper/Gold ratio and ISM Manufacturing PMI show a strong historical relationship with Bitcoin when normalized via Z-scores.
- On-chain stablecoin metrics, especially the Stablecoin Supply Ratio (SSR), suggest a liquidity imbalance often seen near market bottoms.
- The apparent divergence between macro weakness and Bitcoin’s relatively high price may indicate a coiled spring rather than a breakdown.
- For investors and builders seeking the next wave of crypto opportunities, the data implies that the real expansion phase may not have started yet.
1. Market Context: Is This the Top or Just a Pause?
Bitcoin (BTC) is once again in a correction phase, prompting a familiar but critical debate across crypto markets: Is this the end of the cycle, or merely a pause before the next expansion?
As of early 2026, Bitcoin remains priced significantly above its long-term cost basis, measured in USD, even after recent drawdowns. This resilience has fueled two competing narratives.
One camp argues that Bitcoin has already priced in most bullish expectations—ETF adoption, institutional custody, and broader macro normalization. From this perspective, the recent correction is interpreted as a topping process, with risk assets vulnerable to a prolonged downturn.
The opposing camp, however, views the correction as structurally healthy. According to this view, Bitcoin is digesting gains while waiting for clearer macro and liquidity catalysts. Rather than signaling exhaustion, the market may simply be consolidating above its long-term support trend.
To evaluate these claims objectively, analysts are increasingly turning to macro-economic indicators and on-chain liquidity metrics, rather than price action alone.
2. Why Bitcoin Cannot Ignore Macro Economics
A long-standing misconception in crypto markets is that Bitcoin can fully decouple from the global economy. While short-term divergences do occur, longer-term data consistently shows that Bitcoin behaves as a high-beta macro asset when measured in USD terms.
The Copper/Gold Ratio as a Risk Barometer
One macro indicator gaining renewed attention is the Copper/Gold (Cu/Au) ratio. Copper is closely tied to industrial activity and global growth expectations, while gold functions as a defensive, risk-off asset. The ratio between the two is therefore widely used as a proxy for global risk appetite.
Analyst Smitty recently visualized the Copper/Gold ratio against Bitcoin’s price using Z-scores, a statistical normalization technique that allows comparison across different units and scales.
A Z-score measures how far a data point deviates from its historical mean in standard deviation terms.
A value of 0 represents the long-term average, positive values indicate above-average conditions, and negative values indicate below-average conditions.
When plotted together, Bitcoin and the Copper/Gold ratio display a striking long-term correlation. Periods of sustained risk-on behavior in global markets tend to align with Bitcoin expansions, while risk-off environments coincide with Bitcoin drawdowns.
Image Insertion Point ①
“Bitcoin vs Copper/Gold Ratio (Z-Score Comparison)”
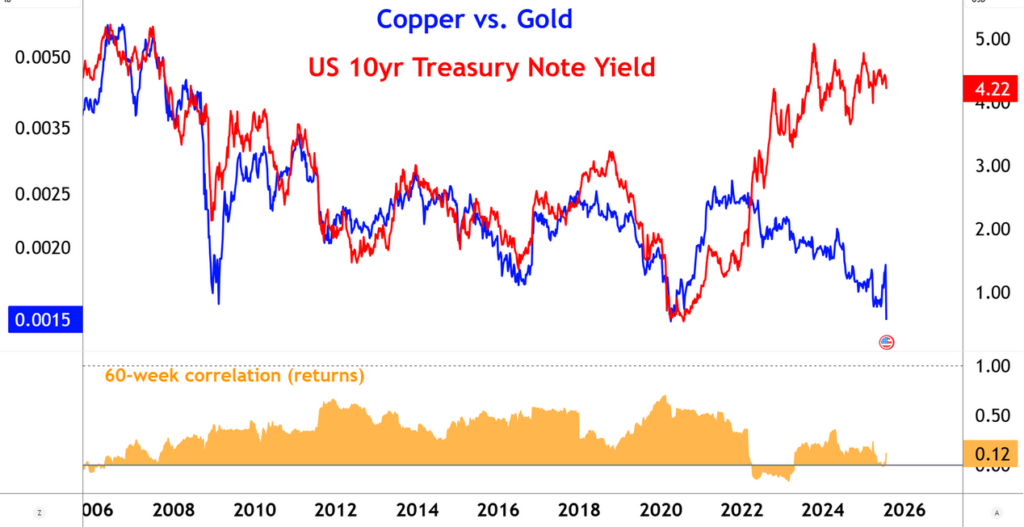
At present, the Copper/Gold ratio sits deep in negative Z-score territory, reflecting weak global growth expectations. Bitcoin, however, remains relatively elevated. Rather than signaling a fatal divergence, this may suggest that Bitcoin is hovering near its long-term price floor, awaiting a macro trigger.
3. ISM Manufacturing PMI: Tracking the Industrial Cycle
Another macro indicator highlighted by Smitty is the ISM Manufacturing PMI, a USD-denominated survey index measuring U.S. manufacturing sentiment. Historically, PMI inflection points have preceded major shifts in risk assets.
When normalized via Z-scores and compared with Bitcoin, PMI trends show that:
- Bottoming PMI levels often coincide with Bitcoin basing phases.
- Sustained PMI recoveries tend to align with explosive BTC rallies.
Recent data shows ISM PMI gradually recovering from cyclical lows. Bitcoin’s price action appears to be tracking this slow improvement rather than front-running a collapse.
Image Insertion Point ②
“Bitcoin vs ISM Manufacturing PMI (Z-Score)”
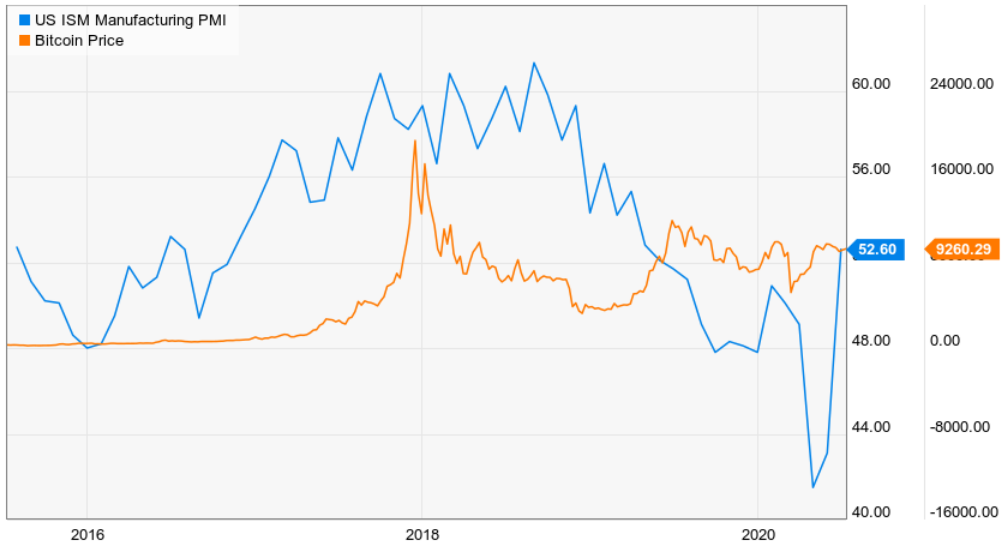
The implication is clear: if PMI accelerates meaningfully, Bitcoin is statistically likely to follow. Conversely, without a sharp PMI breakdown, the case for a definitive Bitcoin cycle top remains weak.
4. “Not the Party Yet”: Interpreting Macro Lag
Smitty summarizes the current situation succinctly: Bitcoin is not topping; it is waiting.
From this viewpoint, macro indicators are not signaling euphoria but latent potential. The party has not started yet—yet conditions suggest it may be approaching.
For investors searching for new crypto assets or yield opportunities, this distinction matters. Late-cycle behavior typically favors defensive positioning, whereas pre-expansion phases reward selective risk-taking, infrastructure building, and accumulation.
5. On-Chain Perspective: Stablecoins as Dry Powder
Macro analysis tells only half the story. On-chain data provides a complementary lens into crypto-native liquidity, particularly through stablecoins.
Understanding the Stablecoin Supply Ratio (SSR)
Crypto analyst Darkfost focuses on the Stablecoin Supply Ratio (SSR), defined as:
SSR = Bitcoin Market Capitalization ÷ Stablecoin Market Capitalization
In USD terms, SSR measures how much stablecoin “buying power” exists relative to Bitcoin’s valuation.
- High SSR → Stablecoin liquidity is low relative to BTC; purchasing power is weak.
- Low SSR → Stablecoin liquidity is high; BTC may be undervalued.
Historically, sharp declines in SSR have occurred near major market bottoms, as Bitcoin’s market cap contracts faster than stablecoin supply.
Image Insertion Point ③
Insert Figure 3: “Bitcoin Price vs Stablecoin Supply Ratio (SSR)”
Following the latest BTC correction, SSR has recorded its steepest drop of the current cycle. This suggests a growing imbalance: stablecoin liquidity remains abundant while Bitcoin’s valuation has compressed.
6. What SSR Is Signaling Now
According to Darkfost, this configuration typically marks a bottoming or accumulation phase rather than a distribution top. The key signal to watch next is the direction of SSR:
- A rising SSR driven by stablecoin deployment would indicate renewed buying pressure.
- A falling stablecoin market cap, by contrast, would suggest liquidity exiting the crypto ecosystem entirely.
Given ongoing geopolitical and trade uncertainties, monitoring stablecoin flows is now as important as tracking price.
7. Practical Implications for Investors and Builders
For readers seeking the next crypto opportunity—whether in new tokens, yield strategies, or blockchain-based business models—the convergence of macro and on-chain signals carries several implications:
- Patience Over Panic
Current conditions resemble pre-expansion phases more than terminal tops. - Liquidity Is Present
Stablecoins represent deployable capital waiting for conviction. - Macro Still Matters
Bitcoin remains structurally tied to global growth expectations when priced in USD. - Builders Have Time
Periods of consolidation historically favor infrastructure development rather than speculative excess.
8. Conclusion: A Market Coiled, Not Broken
Bitcoin’s current correction, when viewed through macro-economic and on-chain lenses, appears less like a cycle peak and more like a market catching its breath. Copper/Gold ratios and ISM PMI suggest macro headwinds are easing rather than worsening, while stablecoin metrics point to latent liquidity rather than capital flight.
For those searching for new crypto assets, sustainable yield, or real-world blockchain applications, the data implies that the most significant phase of the cycle may still lie ahead. The party has not started—but the lights are turning on.
