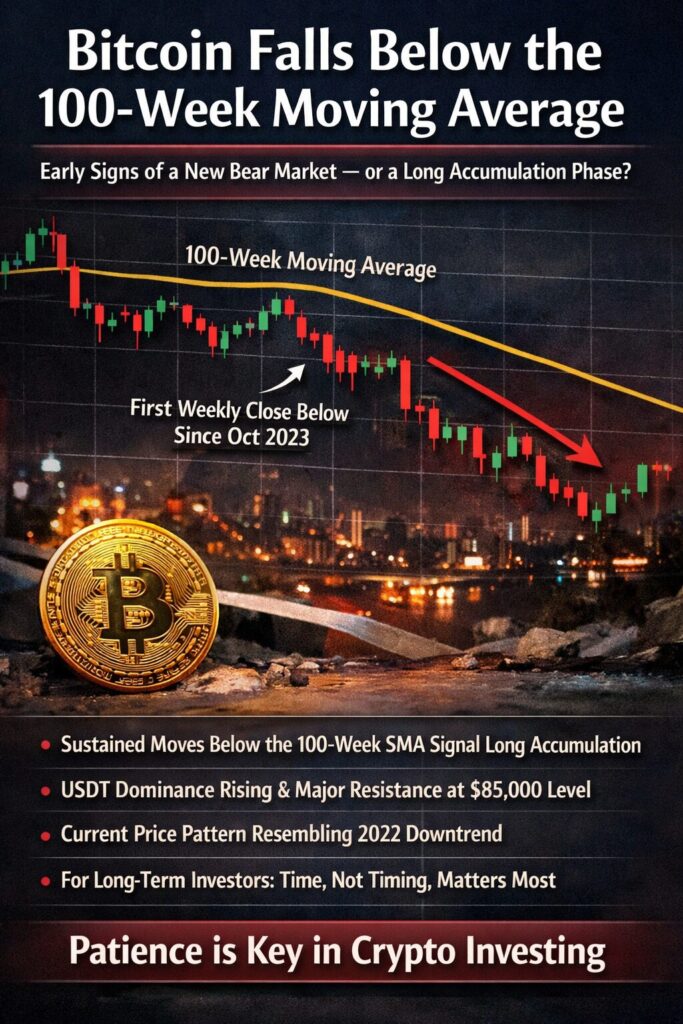
Bitcoin has closed a weekly candle below its 100-week simple moving average (SMA) for the first time since October 2023.
Historically, sustained moves below the 100-week SMA have marked prolonged accumulation phases rather than immediate rebounds.
Rising USDT dominance and heavy resistance around the $85,000 level suggest persistent sell pressure in the near term.
Current price behavior shows strong similarities to the 2022 downtrend fractal.
For investors seeking long-term opportunity, time — not timing — may once again be the critical variable.
1. Bitcoin Breaks a Long-Term Weekly Trend
Bitcoin (BTC) closed its latest weekly candle at $76,931, slipping below the 100-week simple moving average (SMA) for the first time in over a year. The 100-week SMA, currently located around $87,500, is widely regarded as one of Bitcoin’s most important macro-trend indicators.
A weekly close below this level does not merely represent short-term volatility. Instead, it often signals a shift in long-term market structure — one that demands attention from investors, traders, and institutions alike.
Historically, Bitcoin has rarely traded below the 100-week SMA without entering a prolonged period of consolidation or accumulation. These phases are typically characterized by declining volatility, reduced speculative interest, and slow redistribution of coins from weak hands to stronger long-term holders.
This development has reignited debate across the crypto market: is Bitcoin entering the early stages of another bear market, or is this simply a temporary reset within a broader long-term uptrend?
2. Historical Context: What Happens After Bitcoin Breaks the 100-Week SMA?
Analyst Brett highlighted that, aside from the COVID-19 flash crash in 2020, Bitcoin has historically spent extended periods below the 100-week SMA during major bear cycles.
2014–2015 Cycle
After the 2013 bull market peak, Bitcoin traded below the 100-week SMA for 357 days, fluctuating between $200 and $600. Rather than a sharp rebound, the market entered a slow accumulation phase that eventually laid the foundation for the 2017 bull run.
2018–2019 Cycle
Bitcoin remained below the 100-week SMA for 182 days, forming a macro bottom between $3,000 and $6,000. This period marked the exhaustion of speculative excess following the ICO boom.
2022–2023 Cycle
Following the collapse of FTX, Bitcoin spent approximately 532 days below the 100-week SMA, consolidating between $16,000 and $25,000. This phase saw institutional disengagement, miner capitulation, and broad market pessimism — all of which eventually preceded recovery.
Across all cycles, one pattern remains consistent: Bitcoin does not rebound quickly after breaking this level. Instead, it transitions into a time-based accumulation process where patience is rewarded more than aggressive positioning.
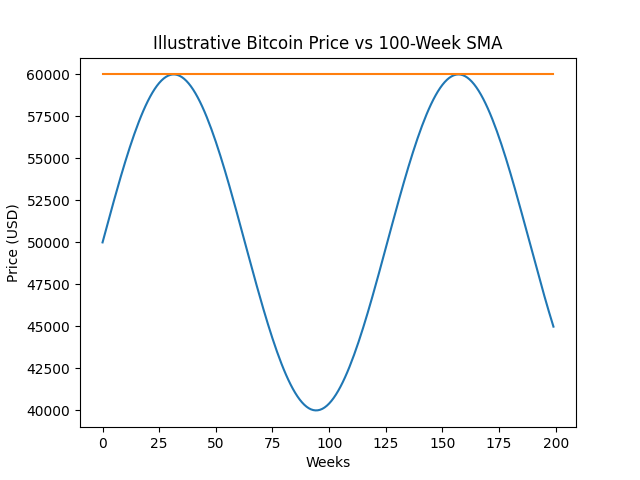
Bitcoin Price vs. 100-Week SMA (Weekly)
A long-term weekly BTC/USD chart highlighting periods when price traded below the 100-week SMA
3. USDT Dominance: A Silent Warning Signal
Another key indicator flashing caution is USDT dominance. Crypto analyst Sherlock pointed out that USDT dominance has broken above 7.2% on a weekly closing basis, a level not seen in more than two and a half years.
Historically, weekly closes above 6.7% have coincided with confirmed bearish market environments. Rising stablecoin dominance typically reflects capital rotating out of risk assets and into cash-like instruments — a defensive posture by market participants.
In practical terms, this means liquidity is being preserved rather than deployed. For Bitcoin and altcoins alike, such environments tend to suppress upside momentum and amplify downside moves.
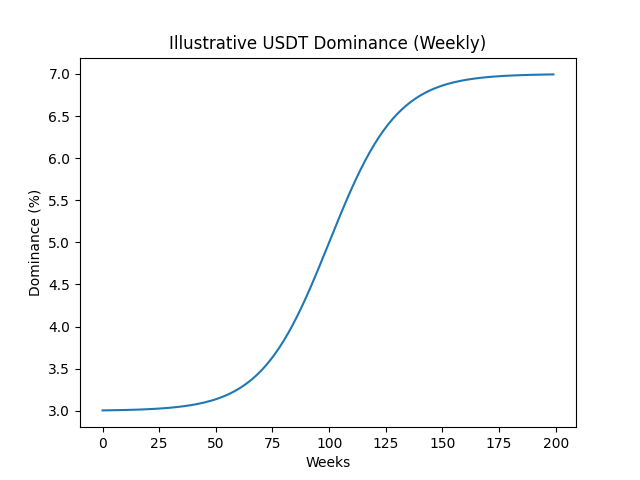
USDT Dominance Weekly Chart
USDT market share during bullish vs. bearish crypto cycles
4. The $85,000 Resistance Zone and Structural Sell Pressure
Sherlock also emphasized $85,000 as a critical resistance level for Bitcoin.
During Q4 2025, more than $120 billion in spot trading volume occurred between $85,000 and $95,000. This zone now represents a large cluster of holders sitting at or near breakeven.
With Bitcoin currently trading around $78,000, any rebound toward $85,000 may trigger persistent sell pressure as investors attempt to exit positions without realizing losses.
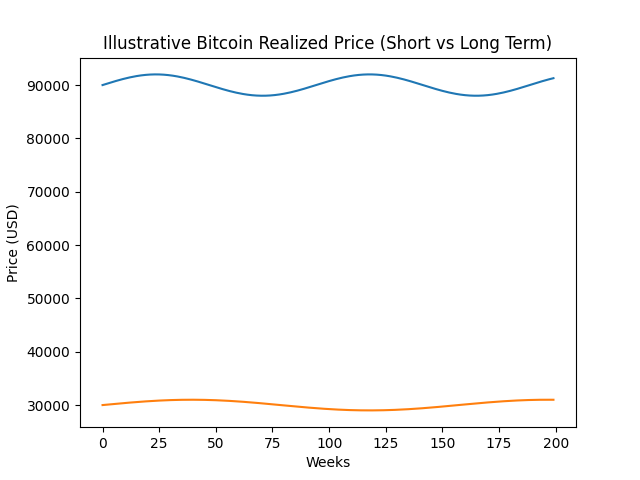
On-chain data supports this thesis. The realized price for short-term holders (1–3 months) is currently near $91,500, meaning many recent buyers remain underwater. Historically, such conditions increase the probability of supply being released into rallies.
Bitcoin Realized Price by Holding Period
Short-term vs. long-term holder realized prices
5. A Familiar Fractal: Echoes of the 2022 Downtrend
From a pure price-structure perspective, Bitcoin’s current weekly chart bears a striking resemblance to the 2022 downtrend.
In that cycle, Bitcoin formed a series of lower highs and lower lows, briefly dipped below the 100-week SMA, failed to reclaim it, and eventually entered a deeper correction before bottoming.
As of early 2026, a similar fractal appears to be forming. If this pattern continues, Bitcoin could revisit the $40,000–$45,000 demand zone — a level historically associated with strong long-term buying interest.
It is important to emphasize that fractals do not predict the future. However, they do illustrate probabilistic risk. Until Bitcoin decisively reclaims the 100-week SMA, downside risk remains elevated.
Bitcoin Weekly Chart — 2022 vs. 2026 Comparison
Visual comparison of similar structural breakdowns
6. What This Means for Investors Seeking New Opportunities
For readers interested in discovering new crypto assets, alternative income streams, or practical blockchain use cases, this environment demands a shift in mindset.
Historically, the periods below the 100-week SMA have been among the most productive times for:
Accumulating high-conviction assets at reduced valuations
Identifying emerging Layer-1s and infrastructure projects
Building yield strategies that do not rely on price appreciation alone
Developing real-world blockchain applications while speculative noise is low
Rather than signaling the end of opportunity, prolonged consolidation phases often represent the beginning of asymmetric setups for patient capital.
Conclusion: Time Over Timing Once Again
Bitcoin’s break below the 100-week moving average is not a trivial technical event. History suggests it rarely resolves quickly and often ushers in extended periods of consolidation and accumulation.
Rising USDT dominance, heavy resistance near $85,000, and fractal similarities to 2022 all point to sustained uncertainty in the months ahead. Yet, these same conditions have historically preceded some of Bitcoin’s most powerful long-term recoveries.
For investors focused on fundamentals, infrastructure, and real utility, this phase may prove less threatening — and more fertile — than it appears on the surface.
About Us and Media
Blockchain and cryptocurrency media covering and exposing the practical application development on the blockchain industry and undiscovered coins.
Click edit button to change this text. Lorem ipsum dolor sit amet, consectetur adipiscing elit
Manage Consent
To provide the best experiences, we use technologies like cookies to store and/or access device information. Consenting to these technologies will allow us to process data such as browsing behavior or unique IDs on this site. Not consenting or withdrawing consent, may adversely affect certain features and functions.
Functional Always active
The technical storage or access is strictly necessary for the legitimate purpose of enabling the use of a specific service explicitly requested by the subscriber or user, or for the sole purpose of carrying out the transmission of a communication over an electronic communications network.
Preferences
The technical storage or access is necessary for the legitimate purpose of storing preferences that are not requested by the subscriber or user.
Statistics
The technical storage or access that is used exclusively for statistical purposes.The technical storage or access that is used exclusively for anonymous statistical purposes. Without a subpoena, voluntary compliance on the part of your Internet Service Provider, or additional records from a third party, information stored or retrieved for this purpose alone cannot usually be used to identify you.
Marketing
The technical storage or access is required to create user profiles to send advertising, or to track the user on a website or across several websites for similar marketing purposes.