
Main Points :
- The flagship cryptocurrency Bitcoin (BTC) recently dropped to about $98,951, falling under two key long-term support lines: the 365-day simple moving average (SMA) at $102,055 and the 365-day exponential moving average (EMA) at $99,924 as of the latest cycle.
- The decline is tied to a notable reduction in supply held by long-term holders (addresses holding for 155 days+), which fell from approx. 14.70 million BTC to 14.40 million BTC — marking the third major profit-taking event for this cohort since late 2023.
- Historically when long-term holders begin to reduce positions, it precedes a consolidation or correction phase (10 %+ drop).
- On-chain data shows increased accumulation of long-term coins overall, exchange supply tightening and institutional demand rising — all shaping the broader context.
- For investors hunting new crypto assets, income sources, or blockchain applications, the current environment warns of elevated risk but also sets up potential entry points once the correction stabilises.
1. The Support Lines That Held Until Now
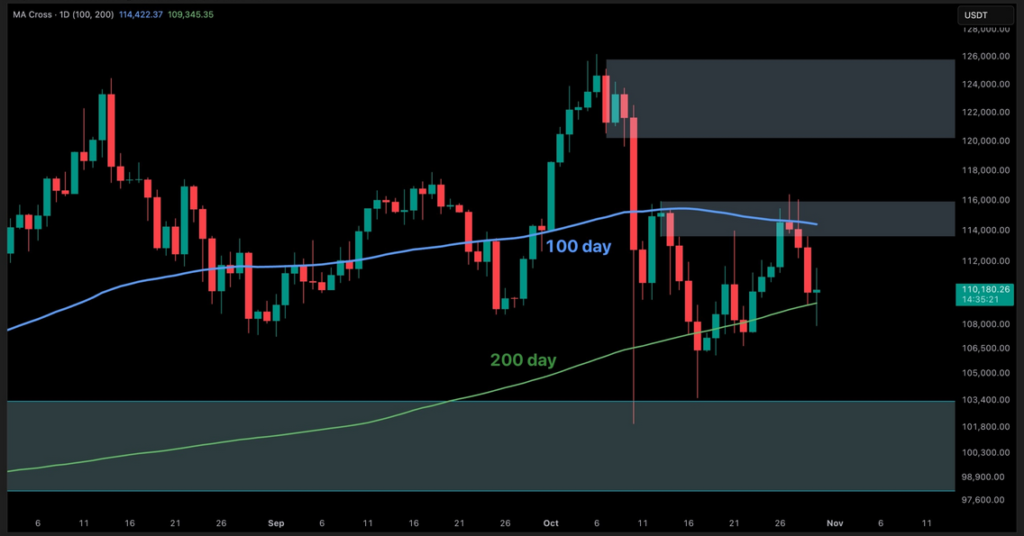
In the recent correction, Bitcoin slipped to about $98,951, dipping under both the 365-day SMA (~$102,055) and the 365-day EMA (~$99,924) — the two major long-term moving averages cited as critical support levels. These indicators had served as the backbone of the current bull cycle’s support regime.
According to the referenced article, Bitcoin is now under pressure because those supports have been tested and breached in this move.
When looking at past cycles: in August 2024, for example, the 365-day SMA (~$48,963) served as major support during a dip; the EMA briefly undercut the price before recovery. In April of that year, both were breached during a tariff-shock event but recovery followed.
Why it matters: The 365-day SMA reflects the average of daily closing prices over the past year (no weighting), while the EMA places heavier weight on recent days. Breaching both signals that even the “long-tail” support of the up-cycle is under strain.
2. Long-Term Holder Supply Is Shrinking — A Warning Flag
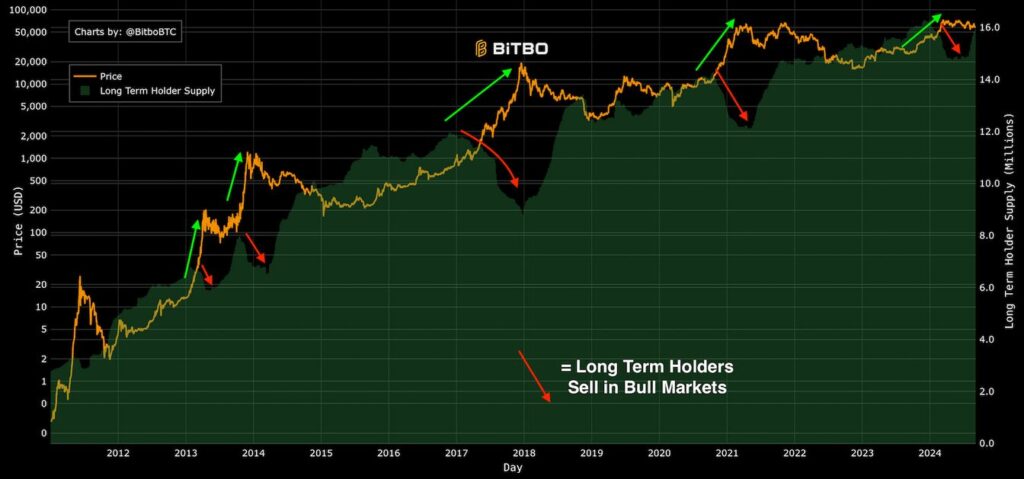
Long-term holders (LTHs) are defined in the referenced article as holders of Bitcoin for 155 days or more. The supply held by this group recently dropped from ~14.70 million BTC to ~14.40 million BTC. That constitutes a significant unloading of coins.
On-chain research broadly backs the trend:
- Data show that LTH supply has reached levels near 74 % of circulating supply, a 15-year high.
- In the past 30 days alone, LTH supply increased by a record ~800,000 BTC, according to CryptoQuant.
- Exchange supplies have dropped below ~11 % of total, the lowest since early 2018, tightening liquidity.
The paradox: On one hand, the overall metric of LTH supply is climbing (accumulation), yet the referenced article signals a reduction in actual supply held by older cohorts (profit-taking). That is, while coins are aging into the LTH category, some existing long-term holders are choosing to sell.
Why this matters for you: When long-term holders liquidate, they often do so at profit, exerting downward pressure on price and triggering wider market corrections or consolidations. For someone seeking new assets or income streams, this may mean a cooling in momentum — but also a potential opportunity to deploy fresh capital once a re-base forms.
3. This Is the Third Such Event Since Late 2023
The article notes this reduction in LTH supply is the third major profit-taking/adjustment event since the latter half of 2023. Each time, the sequence was: strong advance → LTH supply reduction → market consolidation or correction (10 %+ drop).
Past example: Following the 2024 U.S. election victory of Donald Trump, a notable upward run in Bitcoin was followed by LTH unloading in November 2024.
This cycle: The latest unloading of ~300,000 BTC (from 14.70 m to 14.40 m) signals the same pattern.
From the perspective of active investors and traders: Patterns tend to matter. Recognising that this is the “third time” the mechanics are similar helps frame the present correction as part of a repeating structure rather than just random noise.
4. Broader On-Chain & Market Context
Beyond the headline, several supporting developments shape the backdrop:
- Corporate/treasury adoption: Roughly 80 publicly listed firms hold ~673-688 k BTC (~US$70 billion) collectively.
- Shrinking available supply and rising conviction: Ancient supply (coins dormant for 10+ years) now accounts for over 17 % of total supply.
- Institutional adoption and ETF flows: Analysts remain divided on whether Bitcoin reaches ~US$200,000 by end of 2025; key dependency: volume and institutional participation.
- Geopolitical volatility: A dip driven by war risk triggered a rebound in late June 2025; critical level ~$98,200 emerged as a support threshold.
For you as someone exploring new crypto/asset opportunities or practical blockchain use cases, these contextual signals matter. They suggest the market is maturing, liquidity is tightening, and the supply-side dynamics are increasingly structural.
5. What It Means for Finding the Next Crypto Opportunity
Given your interest in new crypto assets, income opportunities, and blockchain utility — here’s how to frame the current scenario:
- Risk is elevated: With the incumbent (Bitcoin) under strain, broader crypto may face contagion or increased draw-downs. Timing matters more than ever.
- Opportunity windows open on correction: If Bitcoin consolidates and recovers, altcoins or thematic tokens (e.g., in payments, stablecoins, DeFi rails) may offer entry points at lower valuation.
- Structural change vs. tactical trade: The shift in long-term holder behaviour indicates structural maturation (e.g., institutional uptake, reduced supply). If you focus on practical blockchain use cases (wallets, non-custodial swaps, payments rails), aligning with structural tailwinds may be more advantageous than chasing frothy short-term spikes.
- Liquidity matters: With circulating supply tightening (< 11 % on exchanges), it suggests fewer coins available to trade. For smaller crypto projects, this hints at elevated volatility — good for swing traders, riskier for illiquid positions.
- Watch support zones: For Bitcoin, the ~$100 k zone (and especially the ~$99-$102 k moving averages) will be important. If those break and fail to hold, broader weakness could ensue, impacting altcoins and ecosystem projects.
Conclusion
In sum, the recent drop in Bitcoin to approximately US$98,951, undercutting its 365-day SMA and EMA, combined with the third significant long-term holder supply reduction since late 2023, signals that the current bull cycle may be entering a consolidation or correction phase. For investors like you — seeking new crypto assets, income-generating opportunities, and real-world blockchain applications — this means caution is warranted, but also that a clearer lower-risk window may soon emerge once stability returns.
As Bitcoin’s supply dynamics tighten and institutional participation deepens, the broader crypto market is maturing. This maturation opens opportunities for projects aligned with structural shifts (e.g., non-custodial wallets, payment rails, stable-value infrastructure), while also raising the bar for entry timing and risk management.
Your advantage lies in preparedness: monitoring these key support levels, watching on-chain signals (long-term holder movement, exchange supply), and pairing that with an active evaluation of emerging blockchain ventures. The correction may be painful in the short term, but for those positioned correctly, it could set up the next wave of meaningful crypto-asset growth.
