
Main Takeaways :
- A sudden inflow of approximately 17,000 BTC (about $1.6 billion) into exchanges preceded Bitcoin’s drop below the $90,000 level, signaling structural rather than emotional selling pressure.
- On-chain data shows that short-term holders are realizing losses, with the SOPR indicator remaining below the key 1.0 threshold, turning former support into resistance.
- The recent rebound toward $90,000 should be viewed not as a trend reversal, but as a second exit opportunity for sellers.
- In contrast, long-term institutional accumulation continues, especially among U.S. custody wallets holding 100–1,000 BTC, reflecting a clear time-horizon divergence in the market.
- For investors seeking new crypto assets or yield opportunities, the current phase highlights the importance of on-chain context, liquidity timing, and structural flow analysis.
Introduction: When the Blockchain Speaks Before the Price
Bitcoin’s price action often appears sudden to casual observers, but on-chain data frequently tells a different story. In late January 2026, as Bitcoin slipped below the psychologically important $90,000 level, blockchain analysts identified a notable precursor: an unusually large inflow of BTC into centralized exchanges.
According to on-chain analyst Adler, approximately 17,000 BTC moved into exchanges between January 20 and January 21—equivalent to roughly $1.6 billion at prevailing prices. Such flows are rarely neutral. Historically, sharp exchange inflows during declining markets tend to reflect pre-positioned supply for selling, not routine transfers.
This article examines what those flows mean, how short-term holder behavior reinforces the bearish structure, and why institutional demand paints a very different long-term picture. By combining the referenced article with broader market data and recent trends, we aim to provide practical insight for investors and builders focused on real-world crypto usage and sustainable returns.
Massive BTC Exchange Inflows Signal Structural Selling
Adler’s analysis highlights that the exchange inflows occurred before Bitcoin lost the $90,000 level. This timing is critical. Rather than reacting emotionally to price declines, sellers appeared to have prepared liquidity in advance, suggesting deliberate risk management or profit protection strategies.
Exchange Netflow Breakdown
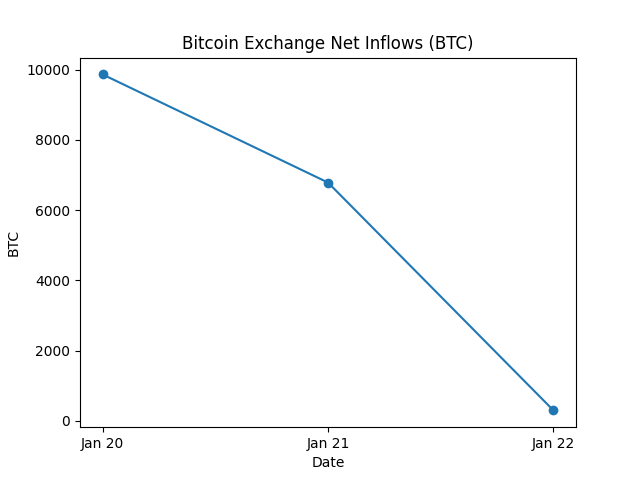
- January 20: 9,867 BTC flowed into exchanges
- January 21: 6,786 BTC flowed into exchanges
- January 22: Netflow normalized to 296 BTC
For most of early January, exchange netflows had remained negative, meaning more BTC was leaving exchanges than entering them. Against that backdrop, the two-day spike stands out as statistically abnormal.
In declining markets, such spikes rarely represent internal wallet reshuffling. Instead, they usually reflect supply staging, where holders position assets close to liquidity venues in anticipation of selling.
【Bitcoin Exchange Net Inflows (BTC)】
Visualizing the abnormal two-day spike in BTC inflows versus normalization afterward.
Why Exchange Inflows Matter More Than Price Alone
Price charts show what happened; on-chain flows help explain why. Exchange inflows are particularly powerful because centralized exchanges remain the primary venues for spot selling and derivatives collateralization.
When inflows rise sharply during price weakness, they often indicate:
- Preparation for spot selling
- Collateralization for short or hedge positions
- Portfolio rebalancing under stress
In this case, the inflows coincided with a broader shift in short-term holder profitability, reinforcing the bearish interpretation.
SOPR Confirms Short-Term Holders Are Selling at a Loss
The Spent Output Profit Ratio (SOPR) for short-term holders compares the selling price of coins to their acquisition price. A value above 1.0 indicates profit-taking; below 1.0 indicates loss realization.
During this recent downturn:
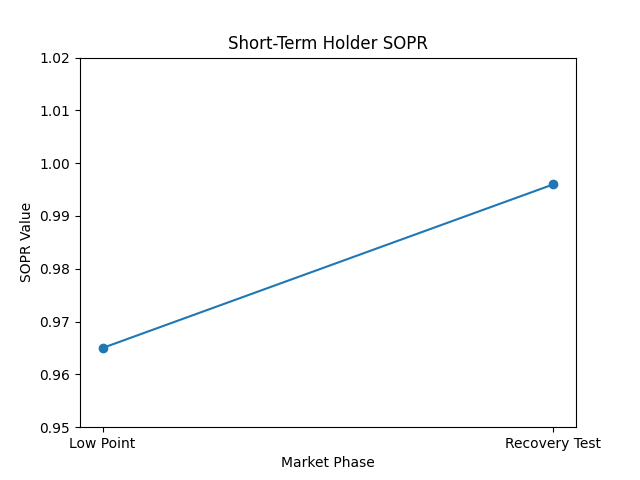
- The 7-day moving average (SMA) of SOPR fell to 0.996, remaining persistently below 1.0.
- At the local low of $87,500, SOPR dropped to 0.965, implying an average realized loss of about 3.5% for short-term holders.
This matters because SOPR behavior often defines market structure. When SOPR is below 1.0, prior support levels tend to transform into resistance as underwater holders seek to exit at breakeven.
【Short-Term Holder SOPR】
Illustrating the shift from loss realization to resistance testing near SOPR = 1.0.
From Support to Resistance: The $90,000–$100,000 Trap
Adler emphasizes that the recovery from $87,500 back toward the $89,000–$90,000 range should not be mistaken for a trend reversal. Instead, it represents a classic resistance test.
Short-term holders who bought between $90,000 and $100,000 now face a choice:
- Exit at breakeven as price approaches their entry zone
- Hold and risk deeper drawdowns
Historically, many choose the former. This creates overhead supply that caps rallies until SOPR decisively reclaims and holds above 1.0.
According to Adler, a genuine reversal would require:
- SOPR breaking above 1.0 from below
- The 7-day SMA remaining above 1.0 for 3–5 consecutive days
Until then, rallies should be treated cautiously.
Two Charts, One Story: Unified On-Chain Narrative
What makes this phase particularly compelling is the alignment of multiple indicators:
- Exchange inflows show sellers preparing liquidity.
- SOPR confirms that short-term holders are already in loss territory.
Together, they form a coherent narrative: the market is not panicking, but systematically de-risking.
This distinction is critical for professional investors. Emotional capitulation often marks bottoms; structural distribution tends to persist.
Institutional Accumulation Tells a Different Story
While short-term dynamics appear bearish, longer-term data reveals a contrasting trend. According to CryptoQuant, CEO Ki Young Ju notes that institutional demand remains strong.
U.S. Custody Wallet Growth
Wallets (excluding exchanges and miners) holding 100–1,000 BTC have shown remarkable accumulation:
- +577,000 BTC over the past year
- Equivalent to approximately $53 billion at current prices
Since the approval of U.S. spot Bitcoin ETFs in January 2024, total holdings in this category have increased from roughly 4.0 million BTC to 5.3 million BTC.
This suggests that while short-term traders are exiting, institutional capital is quietly absorbing supply.
Whale Behavior on Binance Is Cooling, Not Accelerating
Additional insight comes from whale flows to Binance. Over the past 30 days:
- Whale transfers to Binance fell from $7.88 billion in November
- To approximately $2.74 billion currently
On-chain analyst Darkfost interprets this as restraint rather than distribution. Large holders appear to be waiting, not rushing to sell into weakness.
This divergence—short-term selling versus long-term accumulation—is typical of mid-cycle consolidations rather than macro tops.
Market Context: Why This Matters Beyond Price Speculation
For readers interested in practical blockchain use and sustainable revenue models, this episode offers broader lessons:
- Liquidity positioning matters more than headlines
- On-chain metrics can reveal intent before price reacts
- Different time horizons coexist, creating opportunity for disciplined strategies
Projects building treasury strategies, yield products, or payment rails should pay close attention to structural flows, not just volatility.
Outlook: Risk Management, Not Panic
Bitcoin is currently navigating a zone of structural resistance, not collapse. While downside risks remain, especially if SOPR fails to reclaim 1.0, the absence of aggressive whale selling and continued institutional accumulation argue against a disorderly breakdown.
As firms like ARK Invest, led by Cathie Wood, continue to project long-term valuations in the multi-trillion-dollar range, short-term turbulence should be viewed in context.
Conclusion: A Market Divided by Time Horizon
The recent $1.6 billion BTC exchange inflow episode underscores a fundamental truth of crypto markets: not all sellers are bearish, and not all buyers are bullish—they simply operate on different clocks.
Short-term holders are responding to pressure, managing losses, and seeking exits. Long-term institutions are accumulating patiently, largely indifferent to near-term noise.
For investors searching for the next opportunity—whether in assets, yield, or infrastructure—the key takeaway is clear: understanding who is acting, why, and on what timeframe is more valuable than any single price level.
